søndag 27. mai 2018

THE LITTLE ICE AGE EXPLAINED


AGW.

The "idea" that, even after 150 years and billions of data points filtered through the scientific method, and based upon the principles of basic physics, top climate scientist and the tens of thousands of peer reviewed papers they'd written,  had to put AGW theory to rest because they.....had... never... heard... of.. the.. (elephant in the room), the... so ...called... Little Ice Age...before an amateur denier  tipped them about in a facebook thread.


The Little Ice Age is often cited by climate change deniers as proof humans are not causing global warming. The theory goes that Earth is naturally coming out of a period of coolness, and thus the changes in global temperature are merely coincidental.

We’ve known for a while that argument is essentially crap. But now a new study has further cemented its crapness by discovering that the Little Ice Age was almost insignificant, and cannot account for modern temperature increases.

It didnt effect the whole world, like uniform, at the same time. It kind of “wandered” across different parts.

This was a modestly cool period running from about the year 1300 to 1850. It was particularly cold in the UK, where the River Thames sometimes froze over, and ‘frost fairs’ were held.
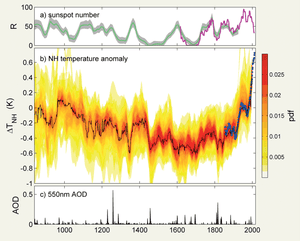
A team led by University of Reading physicist and solar expert Mike Lockwood wrote a paper reviewing the science behind frost fairs, sunspots, and the LIA. It included the figure below showing northern hemisphere temperatures along with sunspot number and the level of volcanic particles in the atmosphere over the past millennium:
Sunspot number, northern hemisphere temperatures, and volcanic aerosol optical depth (AOD) around the time of the Little Ice Age.
Sunspot number, northern hemisphere temperatures, and volcanic aerosol optical depth (AOD) around the time of the Little Ice Age. Illustration: Lockwood et al. (2017), News & Reviews in Astronomy & Geophysics
During full blown ice ages, temperatures have generally been 4–8°C colder than in modern times. As this figure shows, during the LIA, temperatures were at most only about 0.5°C cooler than the early 20th century. Thus, Lockwood calls the Little Ice Age “a total misnomer.” As the authors put it:
"Compared to the changes in the proper ice ages, the so-called Little Ice Age (LIA) is a very short-lived and puny climate and social perturbation."
For comparison, temperatures have risen by a full 1°C over the past 120 years, and 0.7°C over just the past 40 years.

https://www.theguardian.com/environment/climate-consensus-97-per-cent/2018/jan/09/the-imminent-mini-ice-age-myth-is-back-and-its-still-wrong
The main drivers of the Little Ice Age cooling were decreased solar activity and increased volcanic activity. These factors cannot account for the global warming observed over the past 50-100 years. Furthermore, it is physically incorrect to state that the planet is simply "recovering" from the Little Ice Age.

What ended the Little Ice Age?


Study on the Little Ice Age: Low solar activity just marginally cools the climate.

Abrupt onset of the Little Ice Age triggered by volcanism and sustained by sea‐ice/ocean feedbacks

https://agupubs.onlinelibrary.wiley.com/doi/full/10.1029/2011GL050168

The weakening sun was not the determinant factor for the Little Ice Age. Strong volcanic eruptions in particular, but also a smaller amount of greenhouse gases in the atmosphere were important factors during this period of cooler climate in the 16th and 17th century, a new study shows.

Impact of Volcanic Eruptions on Decadal to Centennial Fluctuations of Arctic Sea Ice Extent during the Last Millennium and on Initiation of the Little Ice Age

https://journals.ametsoc.org/doi/abs/10.1175/JCLI-D-16-0498.1

Global Signatures and Dynamical Origins of the Little Ice Age and Medieval Climate Anomaly
Abstract


Global temperatures are known to have varied over the past 1500 years, but the spatial patterns have remained poorly defined. We used a global climate proxy network to reconstruct surface temperature patterns over this interval. The Medieval period is found to display warmth that matches or exceeds that of the past decade in some regions, but which falls well below recent levels globally. This period is marked by a tendency for La Niña–like conditions in the tropical Pacific. The coldest temperatures of the Little Ice Age are observed over the interval 1400 to 1700 C.E., with greatest cooling over the extratropical Northern Hemisphere continents. The patterns of temperature change imply dynamical responses of climate to natural radiative forcing changes involving El Niño and the North Atlantic Oscillation–Arctic Oscillation.

http://science.sciencemag.org/content/326/5957/1256

Frost fairs, sunspots and the Little Ice Age

Frost fairs, sunspots and the Little Ice Age | Astronomy & Geophysics | Oxford Academic

Frost fairs have also been a key piece of “evidence” supporting the Little Ice Age. In 17th and 18th-century London, the Thames was said to have frozen over on multiple occasions, allowing people to celebrate on the icy river. This stopped in the 19th century, supposedly as the world came out of the Little Ice Age.
But the researchers found the ending of frost fairs had nothing to do with climate change. It was actually the result of an increased river flow, caused by the original London Bridge being demolished in 1825, and the Victoria embankment opening in 1870. Paintings from the era also continued to depict both warm and cool temperatures.
https://www.iflscience.com/environment/the-little-ice-age-was-very-very-little/


The Hockeystick confirms it all:

The Stick have been confirmed and improved by the 4 most comprehensive studies on the matter:

5 reasons why Manns "hockeystick" is here to stay. :

1. Its affirmed by US National Academy of Sciences (NAS)

https://www.nature.com/articles/4411032a.pdf?origin=ppub

They are one of the most respectable scientific academies and hold a very strong position world wide and in the US, all the way back since it was co-founded by Abraham Lincoln. As of 2016, the National Academy of Sciences includes about 2,350 members and 450 foreign associates. Approximately 200 members have won a Nobel Prize.

National Academy of Sciences - Wikipedia

Since then the hockey Stick is confirmed and improved by the 4 most comprehensive studies done on the matter:

2. 78 researchers from 24 countries, together with many other colleagues, worked for seven years in the PAGES 2k project on the new climate reconstruction. “2k” stands for the last 2000 years, while PAGES stands for the Past Global Changes program launched in 1991. Recently, their new study was published in Nature Geoscience.
It is based on 511 climate archives from around the world, from sediments, ice cores, tree rings, corals, stalagmites, pollen or historical documents and measurements. All data are freely available.

Most Comprehensive Paleoclimate Reconstruction Confirms Hockey Stick

Continental-scale temperature variability during the past two millennia

3. Planet Earth is warmer than it has been for at least 2,000 years, according to a study that took its temperature from 692 different “natural thermometers” on every continent and ocean on the planet.
The database gathers 692 records from 648 locations, including all continental regions and major ocean basins.
The records are from trees, ice, sediment, corals, speleothems, documentary evidence, and other archives. They range in length from 50 to 2000 years, with a median of 547 years, while temporal resolution ranges from biweekly to centennial.
The world is hotter than it has been for at least 2,000 years

A global multiproxy database for temperature reconstructions of the Common Era

4. Researchers reconstructed temperatures from fossil pollen collected from 642 lake or pond sites across North America -- including water bodies in Wyoming -- and Europe.[...]
The reconstructions indicate that evidence of periods that were significantly warmer than the last decade were limited to a few areas of the North Atlantic that were probably unusual globally. Shuman says results determined that the last decade was roughly 6.5 degrees Fahrenheit warmer today than it was 11,000 years ago. Additionally, the decade was at least one-half degree Fahrenheit warmer today than the warmest periods of that 11,000-year time frame, even counting for uncertainties, Shuman says.

Most of last 11,000 years cooler than past decade in North America, Europe

Reconciling divergent trends and millennial variations in Holocene temperatures

5. A Reconstruction of Regional and Global Temperature for the Past 11,300 Years
https://www2.bc.edu/jeremy-shakun/Marcott%20et%20al.,%202013,%20Science.pdf

BONUS:

The "hockeystick" data IS available here:

Michael E. Mann

Global comparisons of proxy records suggest that there was no globally coherent “Little Ice Age”. This is well illustrated by the PAst Global changEs (PAGES) 2k networks huge proxy assimilation study published in 2013 in Nature Geoscience Continental-scale temperature variability during the past two millennia
“There were no globally synchronous multi-decadal warm or cold intervals that define a worldwide Medieval Warm Period or Little Ice Age, but all reconstructions show generally cold conditions between AD 1580 and 1880, punctuated in some regions by warm decades during the eighteenth century”


søndag 13. mai 2018

MYTH# 17 MODELS ARE NOT ACCURATE


Part of the problem here stems from people either misunderstanding or deliberately misrepresenting how predictive models work. Many people have the unrealistic expectation that the observed data need to be a near perfect match for the prediction line, but that’s not actually how things work. 


Some are still "under the mistaken impression that concern about global warming is based on climate models, which in reality play little role in our understanding -- our understanding is based mainly on how the Earth responded to changes of boundary conditions in the past and on how it is responding to on-going changes."
- Dr. James Hansen
 
 
There is an excellent description of climate models evaluation in the following IPCC report:
Page 600-601 that address how reliable current models are. The last paragraph states:
"In summary, confidence in models comes from their physical basis, and their skill in representing observed climate and past climate changes. Models have proven to be extremely important tools for simulating and understanding climate, and there is considerable confidence that they are able to provide credible quantitative estimates of future climate change, particularly at larger scales. Models continue to have significant limitations, such as in their representation of clouds, which lead to uncer- tainties in the magnitude and timing, as well as regional details, of predicted climate change. Nevertheless, over several decades of model development, they have consistently provided a robust and unambiguous picture of significant climate warming in re-sponse to increasing greenhouse gases."
 Q&A: How do climate models work?
https://www.carbonbrief.org/qa-how-do-climate-models-work
La oss se nærmere på hva forskerne har spådd/modellert og hvordan dette stemte med hva vi vet i dag. 


En grundig gjennomgang av klimamodellene viser oss at de har vært veldig nøyaktige og har truffet særs godt.   
" the close match between projected and observed warming since 1970 suggests that estimates of future warming may prove similarly accurate."!  
Comparing models and observations. 
USAs mest kjente prognosestatistiker, Nate Silver, viet et kapittel til samme spørsmål i sin bok "The Signal and the Noise: The Art and Science of Prediction". Her sammenlignet han prognosetreffsikkerheten fra tidlige klimamodeller med treffsikkerheten andre fag som forsøker å beregne fremtiden (makroøkonomi, seismologi, valgforskning, meteorologi, sportsresultater osv.) Klimamodellene kom bra ut av det. Sceptical Science har mer
"when correcting the model projections to account for the actual greenhouse gasemissions and forcing changes, we see that their temperature projections have been very accurate.[...] we don't even need climate models to realize that we're in for a lot of global warming this century." 

Robust comparison of climate models with observations using blended land air and ocean sea surface temperatures

Here are some actual predictions from Global Climate Models all of which have proven correct:


Here are some actual predictions from Global Climate Models all of which have proven correct:

1.That the globe would warm, and about how fast, and about how much.

2. That the troposphere would warm and the stratosphere would cool.

3. That nighttime temperatures would increase more than daytime temperatures.

4. That winter temperatures would increase more than summer temperatures.

5.Polar amplification (greater temperature increase as you move toward the poles).

6. That the Arctic would warm faster than the Antarctic.

7.The magnitude (0.3 K) and duration (two years) of the cooling from the Mt. Pinatubo eruption.

8.They made a retrodiction for Last Glacial Maximum sea surface temperatures which was inconsistent with the paleo evidence, and better paleo evidence showed the models were right.

9.They predicted a trend significantly different and differently signed from UAH satellite temperatures, and then a bug was found in the satellite data.

10.The amount of water vapor feedback due to ENSO.

11. The response of southern ocean winds to the ozone hole.

12.The expansion of the Hadley cells.

13.The poleward movement of storm tracks.

14.The rising of the tropopause and the effective radiating altitude.

15.The clear sky super greenhouse effect from increased water vapor in the tropics.

16.The near constancy of relative humidity on global average.

17.The expanded range of hurricanes and cyclones--a year before Cyclone Catarina showed up off the coast of Brazil, something which had never happened before.

The First Climate Model Turns 50, And Predicted Global Warming Almost Perfectly 

Modeling the Earth's climate is one of the most daunting, complicated tasks out there. If only we were more like the Moon, things would be easy. The Moon has no atmosphere, no oceans, no icecaps, no seasons, and no complicated flora and fauna to get in the way of simple radiative physics. No wonder it's so challenging to model! In fact, if you google "climate models wrong", eight of the first ten results showcase failure. But headlines are never as reliable as going to the scientific source itself, and the ultimate source, in this case, is the first accurate climate model ever: by Syukuro Manabe and Richard T. Wetherald. 50 years after their groundbreaking 1967 paper, the science can be robustly evaluated, and they got almost everything exactly right.
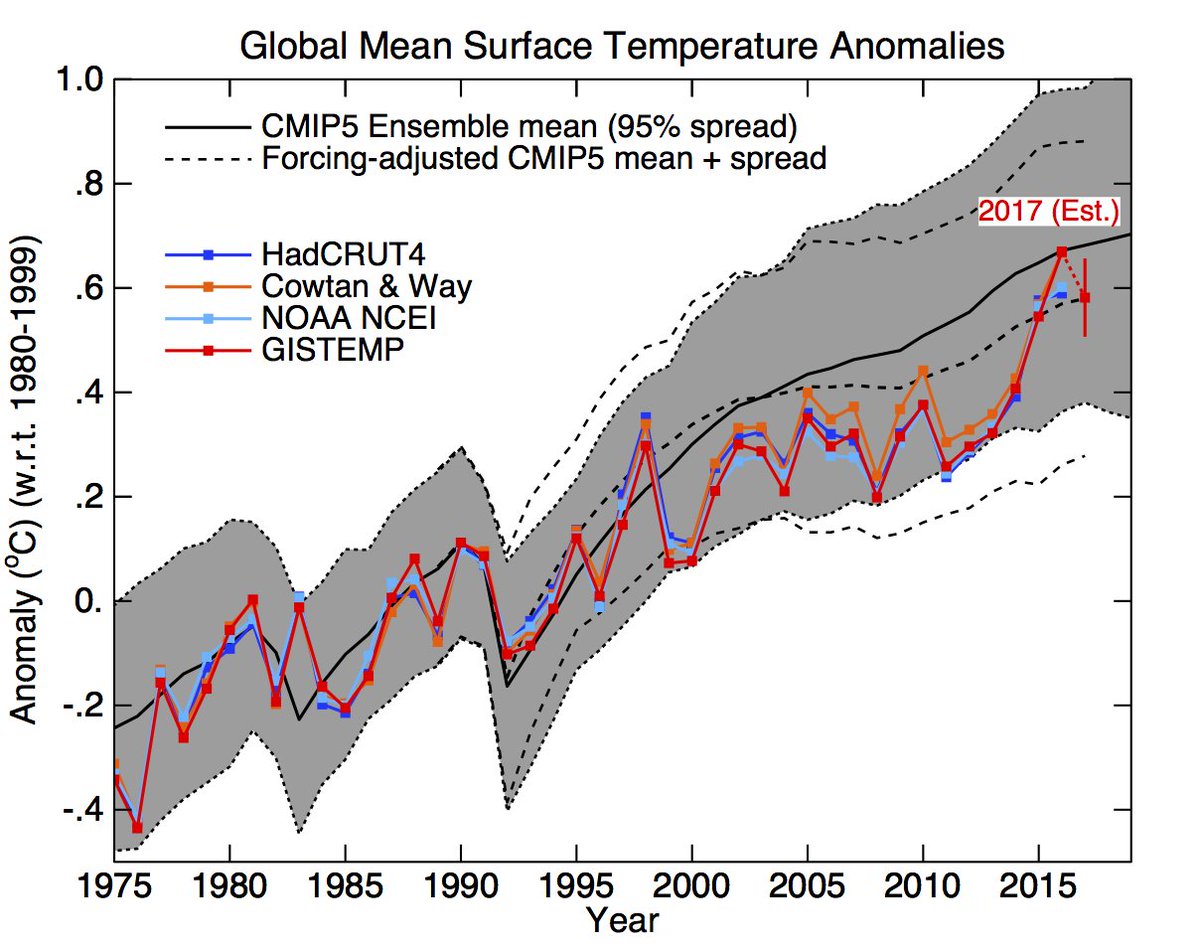
A study, out Wednesday in the journal Science Advances, joins a growing body of literature that suggests the models are on track after all. And while that may be worrisome for the planet, it’s good news for the scientists working to understand its future. Climate models are even more accurate than you thought The difference between modeled and observed global surface temperature changes is 38% smaller than previously thought. Global climate models aren’t given nearly enough credit for their accurate global temperature change projections. As the 2014 IPCC report showed, observed global surface temperature changes have been within the range of climate model simulations. 
Now a new study shows that the models were even more accurate than previously thought. In previous evaluations like the one done by the IPCC, climate model simulations of global surface air temperature were compared to global surface temperature observational records like HadCRUT4. However, over the oceans, HadCRUT4 uses sea surface temperatures rather than air temperatures.


James Hansen wishes he wasn't so right about global warming
https://abcnews.go.com/Technology/wireStory/james-hansen-wishes-global-warming-55969021

Models successfully reproduce temperatures since 1900 globally, by land, in the air and the ocean. CMIP5.
Klimaforsker Gavin Schmidt oppklarer

Sammenligner vi IPPC sine modeller med kjente klimaskeptikeres modeller ser vi at IPPC treffer ganske godt også med sine tidligste modeller, mens klimaskeptikerne bommer fælt. Her ser vi og hvordan klimaskeptikere misbruker IPPC sine data for å skape en myte om at IPPC har overdrevet sine temperaturframskrivninger.  
 
Ny forskning feier all tvil til side:  
Coverage bias in the HadCRUT4 temperature series and its impact on recent temperature trends. "Trends starting in 1997 or 1998 are particularly biased with respect to the global trend. The issue is exacerbated by the strong El Niño event of 1997–1998, which also tends to suppress trends starting during those years."
The existence of bias in recent global mean temperature estimates has been confirmed by multiple means. This bias leads to an underestimation of recent temperature trends. The evidence is as follows. Coverage bias in the HadCRUT4 temperature series and its impact on recent temperature trends. Kevin Cowtan, Robert G. Way (2014)
The new dataset shows substantially increased global-scale warming relative to the previous version of the dataset, particularly after 1998. The new dataset shows more warming than most other midtropospheric data records constructed from the same set of satellites. It is also shown that the new dataset is consistent with long-term changes in total column water vapor over the tropical oceans, lending support to its long-term accuracy.
Sensitivity of Satellite-Derived Tropospheric Temperature Trends to the Diurnal Cycle Adjustment Press Release: 2016 Tropospheric Temperatures. A new press release from Dr. Carl Mears using the Temperature Total Troposphere (TTT) dataset shows that 2016 is the warmest year since the satellite record began in 1979. The previous record, set during the last major El Niño in 1998, was broken by 0.31 degrees Fahrenheit.
A new paper just published in the Journal of Climate is a stunning setback for the darling of cherry-picking for contrarian scientists and elected officials. Let’s walk though this so we appreciate the impact.
In recent years, some scientists have suggested that our climate models may actually be predicting too much future warming, and that climate change will be less severe than the projections suggest. But new research is helping lay these suspicions to rest
What the scientists knew in 1982:

OVERDRIVER FORSKERNE OG SPÅR DE DOMMEDAGSSCENARIER?

En helt ny studie publisert i journalen Climate Change oppklarer.
Study Reviews 1,154 Climate Science Results, Finds No Evidence of Publication Bias
In our research, published in the journal Climatic Change, we analysed more than 1,100 published results from the field of climate change science and found no evidence of under-reporting or missing results – even results that were not statistically significant or showing no positive effects were reported.[...] In scientific terms, we reject the accusation made by climate change skeptics and can confirm that there is no publication bias in climate change research.  
Også FNs Klimapanel sine modeller fremskrivninger har blitt undersøkt:
Claims that the IPCC is alarmist are not supported by evidence, and there are clear indications that the opposite may be the case. "Numerous papers have documented how IPCC predictions are more likely to underestimate the climate response."
Checking 20 years worth of projections shows that the Intergovernmental Panel on Climate Change has consistently underestimated the pace and impacts of global warming. Her er studien som bekrefter dette: 
Climate scientists are not alarmists but have underestimated recent climate changes. ► We identify a directional bias toward erring on the side of least drama (ESLD). ► ESLD is an internal pressure arising from norms of objectivity, restraint, etc. ► ESLD may cause scientists to underpredict or downplay future climate changes. 

On the latest IPPC report:

"it is the report’s summary for policymakers that is causing concern. This is the document politicians will use as a key climate guide when making changes to legislation. Reviewers of earlier drafts say it is being altered to make the dangers of climate change seem less alarming. As a result, they say,, policymakers could seriously underestimate the risks of global warming. Cuts made to the final draft of the summary include:
 Any mention that temperature rises of above 1.5C could lead to increased migrations and conflict;
 All discussion of the danger of the Gulf Stream being disrupted by cold water flowing from the Arctic where more and more sea-ice is melting;
 Warnings about the dangers that 1.5–2C temperature rises could trigger irreversible loss of the Greenland ice sheet and raise sea levels by 1–2 metres over the next two centuries.
Other cuts from the summary include the sentence: “Poverty and disadvantage have increased with recent warming (about 1C) and are expected to increase in many populations as average global temperatures increase from 1C to 1.5C and beyond.”
MEDIENE HAR EN TENDENS TIL Å OVERDRIVE.
Mens klimaforskere advarer om økonomi, trygghet og mat, tegner gjerne mediene et dystrere eller mer sensasjonelt bilde. Klimafornektere liker å pushe en myte om at klimavitenskapen har spådd et "hollywood doom and gloom scenario" og når dette ikke kommer, ja da har de tatt feil igjen. men, som vi har sett, klimaforskernes modeller og "spådommer" er i ganske god kontakt med virkeligheten. 
Analysis: How well have climate models projected global warming?
Conclusion
Climate models published since 1973 have generally been quite skillful in projecting future warming. While some were too low and some too high, they all show outcomes reasonably close to what has actually occurred, especially when discrepancies between predicted and actual CO2 concentrations and other climate forcings are taken into account.
 

tirsdag 17. april 2018

MYTH #18 THE OCEANS ARE OK


New study independently confirms the world's oceans are warming


What they found: The amount of carbon dioxide that can be emitted by human activities before putting the goals of limiting warming to under 2℃, or 3.6℉, out of reach is about 25% less than what was previously calculated.

“Imagine if the ocean was only 30 feet deep,” said Resplandy in a press release. “Our data shows that it would have warmed by 6.5℃, or 11.7℉, every decade since 1991. In comparison, the estimate of the last IPCC assessment report would correspond to a warming of only 4℃, or 7.2℉, every decade.”
"Scientists say the accumulation of heat in the oceans is the strongest evidence of how fast Earth is warming due to heat-trapping gases released by the burning of fossil fuels.Oceans have enormous capacity to hold heat. So ocean temperatures, unlike temperatures on land, are slow to fluctuate from natural forces, such as El Niño/La Niña patterns or volcanic eruptions. Think night and day, said Trenberth. As night falls on land, so do air temperatures. But in the oceans, temperatures vary little."

https://sealevel.nasa.gov/understanding-sea-level/causes/overview?fbclid=IwAR0eOCDfRJoN1dWbFYCMOBz-3bvwu1MQ8ZVSiJ7lkFPNYaZ9JZwSOSR1evk

Rising temperatures can be charted back to the late 1950s, and the last five years were the five hottest on record

https://www.theguardian.com/environment/climate-consensus-97-per-cent/2019/jan/16/our-oceans-broke-heat-records-in-2018-and-the-consequences-are-catastrophic?fbclid=IwAR0e6wHiNRQIE82RFjeq8qB3sDMNPhXuj3o2ffj9y6xGyXSbhDDcsBm_D-0

Tilbake til den store rapporten som var peer reviewed av the National Academy of Sciences.

Fourth National Climate Assessment (NCA4), Volume I.

This report is an authoritative assessment of the science of climate change, with a focus on the United States. It represents the first of two volumes of the Fourth National Climate Assessment, mandated by the Global Change Research Act of 1990.

The world’s oceans have absorbed about 93% of the excess heat caused by greenhouse gas warming since the mid-20th century, making them warmer and altering global and regional climate feedbacks. Ocean heat content has increased at all depths since the 1960s and surface waters have warmed by about 1.3° ± 0.1°F (0.7° ± 0.08°C) per century globally since 1900 to 2016.(Very high confidence)


https://link.springer.com/article/10.1007/s00376-018-8011-z


Why greenhouse gases heat the ocean

– how can a forcing driven by longwave absorption and emission impact the ocean below since the infrared radiation does not penetrate more than a few micrometers into the ocean? Resolution of this conundrum is to be found in the recognition that the skin layer temperature gradient not only exists as a result of the ocean-atmosphere temperature difference, but also helps to control the ocean-atmosphere heat flux. (The ‘skin layer‘ is the very thin – up to 1 mm – layer at the top of ocean that is in direct contact with the atmosphere). Reducing the size of the temperature gradient through the skin layer reduces the flux. Thus, if the absorption of the infrared emission from atmospheric greenhouse gases reduces the gradient through the skin layer, the flow of heat from the ocean beneath will be reduced, leaving more of the heat introduced into the bulk of the upper oceanic layer by the absorption of sunlight to remain there to increase water temperature. Experimental evidence for this mechanism can be seen in at-sea measurements of the ocean skin and bulk temperatures.

Verdenshavene har tatt opp like mye varme de siste 18 åra som de 130 åra før. Vil bedre framtidas klimamodeller.Forskerne bak studien sier til AP at de ikke er de store tallene som bekymrer dem mest, men hvor fort tallene øker.– Dette betyr at mengden energi som fanges i jordas totale klimasystem akselererer, sier hovedforfatter Peter Geckler, klimaforsker ved Lawrence Livermoore. Bjørn Hallvard Samset sier dette også forklarer hvorfor temperaturen på jordoverflata ikke har steget så mye de siste 15–20 åra, til tross for at drivhuseffekten har økt.– Dette er en veldig grei bekreftelse på det vi egentlig har visst lenge – mye energi går i havet. Nå kan vi putte dette tilbake i klimamodellene. Det vil hjelpe oss å lage bedre beregninger for framtidas klima”. CO2 -nivået i havet øker mer enn i atmosfæren og forsterker drivhuseffekten, viser forskning fra UiB.

NOAA: Global Ocean Heat and Salt Content


Scientists have long known that more than 90 percent of the heat energy from man-made global warming goes into the world’s oceans instead of the ground. And they’ve seen ocean heat content rise in recent years. But the new study, using ocean-observing data that goes back to the British research ship Challenger in the 1870s and including high-tech modern underwater monitors and computer models, tracked how much man-made heat has been buried in the oceans in the past 150 years. The world’s oceans absorbed approximately 150 zettajoules of energy from 1865 to 1997, and then absorbed about another 150 in the next 18 years, according to a study published Monday in the journal Nature Climate Change. 

“Til nå har klimaforskere trodd at opptaket av menneskeskapte CO2-utslipp blir jevnt fordelt mellom atmosfære, hav og vegetasjon. Nye og omfattende målinger fra Nord-Atlanteren viser at dette ikke er tilfelle.– CO2 -konsentrasjonen i havoverflaten øker raskere enn i atmosfæren", sier Truls Johannessen ved Geofysisk institutt, UiB.”

Ser du på varmeinnholdet i havet, øker dette i betydelig grad, se figur 1 og 2 her: Dette er en viktig faktor for at globalt havnivå stiger.

As Earth warms, much of the extra heat is stored in the planet’s ocean – but monitoring the magnitude of that heat content is a difficult task. A surprising feature of the tides could help, however. Scientists at NASA’s Goddard Space Flight Center in Greenbelt, Maryland, are developing a new way to use satellite observations of magnetic fields to measure heat stored in the ocean.

Researchers for the first time have identified the detection of sea level “fingerprints”: detectable patterns of sea level variability around the world resulting from changes in Earth’s ice. The new research will aid in sea level projections. As ice sheets and glaciers undergo climate-related melting, certain regions are hit harder, and Greenland and Antarctica contribute differently to the process. For instance, sea level rise in California and Florida generated by the melting of the Antarctic ice sheet is up to 52 percent greater than its average effect on the rest of the world.

Observed and simulated full-depth ocean heat-content changes for 1970–2005 (Lijing Cheng et al 2016)
Greenhouse-gas emissions have created a planetary energy imbalance that is primarily manifested by increasing ocean heat content (OHC).

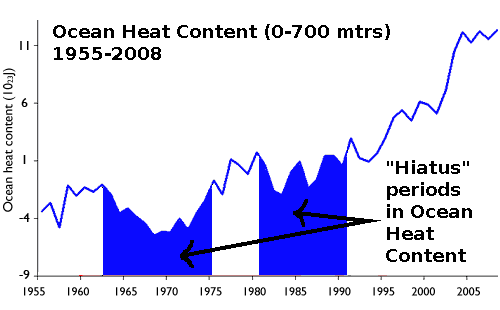
Not only does the climate model-based study, Meehl (2011), show heat is buried into deeper ocean layers when global surface temperatures stall, but it also presents plausible mechanisms in ocean circulation that transport heat down to the deep ocean. The general pattern of sea surface temperature during these hiatus periods is very reminiscent of a La Niña-like climate state. Meehl (2011) is also climate modeling-based study, which finds that decade-long periods of little or no warming are relatively common in the model simulations. This helps to explain why global warming is not a steadily rising, or monotonic trend, consistent with the temperature observations to date.


Figure 1 - Ocean heat content (0-700 mtrs) for the period 1955 to 2008. Adapted from Levitus (2009). Two periods of ocean warming hiatus highlighted in blueBoth periods exceed 10 years in length. This see-sawing of upper ocean heat is simply part of the natural variability inherent in the climate, which occurs even during periods where the ocean is experiencing long-term warming. During these "hiatus" periods the surface layers of the ocean undergo little or no warming, but the ocean below undergoes substantial warming. 

Reconciling controversies about the ‘global warming hiatus’
Between about 1998 and 2012, a time that coincided with political negotiations for preventing climate change, the surface of Earth seemed hardly to warm. This phenomenon, often termed the ‘global warming hiatus’, caused doubt in the public mind about how well anthropogenic climate change and natural variability are understood. Here we show that apparently contradictory conclusions stem from different definitions of ‘hiatus’ and from different datasets. A combination of changes in forcing, uptake of heat by the oceans, natural variability and incomplete observational coverage reconciles models and data. Combined with stronger recent warming trends in newer datasets, we are now more confident than ever that human influence is dominant in long-term warming.

Sea level fluctuations during El Niño (rising) and La Niña (falling) are the result of large exchanges of water between land and ocean in the form of rain and snow. This averages out to zero over time. It does not affect long-term sea level rise, which comes from melting icesheets, glaciers, and thermal expansion.

Varmere hav holder mindre oksygen. Og havene varmes raskt; 90% av global oppvarming foregår i havene. Det er lite oksygen i dypet allerede, og jo varmere det blir, jo høyere opp flytter de ulike oksygennivåene seg. D.v.s. at fisk og dyr som tilpasser seg et spesielt oksygennivå (som de aller fleste av dem gjør) også flytter seg oppover, og fortrenger det som alt var der (videre oppover). https://www.dagbladet.no/nyheter/dette-bildet-bekymrer-forskerne-havene-er-fulle-av-dode-soner/69389820

Scientists predicted in the 1980s that a key fingerprint of anthropogenic climate change would be found in the ocean. If they were correct that increases in greenhouse gases were changing how much heat was coming into the system, then the component with the biggest heat capacity, the oceans, is where most of that heat would end up.

The evidence suggests that ocean heat uptake has accelerated over the last couple of decades, and is likely higher than was reported in IPCC in 2013. The Resplandy et al estimates are consistent with the newer data.

Going back to where we started, what does this allow to conclude about recent climate change? First, the size of the uptake implies that there indeed must be a significant energy imbalance for the planet. This in turn means there must be a larger radiative forcing driving this (for instance, due to the rise in greenhouse gases or an increase in solar activity – other evidence allows us to distinguish between these). But most importantly, this was a predicted effect, made in the earliest (and most basic) simulations as a consequence of a non-negligible climate sensitivity and greenhouse gas increases. In all the hubbub surrounding the latest paper, one would do well to remember that.
http://www.realclimate.org/index.php/archives/2018/11/the-long-story-of-constraining-ocean-heat-content/?fbclid=IwAR0_B8V7JWKBaYNOytsd0nhzrWqWQZ84QupRFImr86YRL1NAviM04NpJKP0#.W_ZUv3tbRgA.facebook

HVA MED HAVNIVÅET?

Satellite measurements tell us that over the past century, the Global Mean Sea Level (GMSL) has risen by 4 to 8 inches (10 to 20 centimeters). However, the annual rate of rise over the past 20 years has been 0.13 inches (3.2 millimeters) a year, roughly twice the average speed of the preceding 80 years.Over the past century, the burning of fossil fuels and other human related activity and natural activities has released enormous amounts of heat-trapping gases into the atmosphere. These emissions have caused the Earth's surface temperature to rise, and the oceans absorb about 80 percent of this additional heat.The rise in sea levels is linked to three primary factors, all induced by this ongoing global climate change.

  • Thermal Expansion: When water heats up, it expands. About half of the past century's rise in sea level is attributable to warmer oceans simply occupying more space.
  • Melting Glaciers and Polar Ice Caps: Large ice formations, like glaciers and the polar ice caps, naturally melt back a bit each summer. In the winter, snows, primarily from evaporated seawater, are generally sufficient to balance out the melting. Recently, though, persistently higher temperatures caused by global warming have led to greater than average summer melting as well as diminished snowfall due to later winters and earlier springs. This imbalance results in a significant net gain in the ratio of runoff to ocean evaporation, causing sea levels to rise.
  • Ice Loss from Greenland and West Antarctica: As with the glaciers and ice caps, increased heat is causing the massive ice sheets that cover Greenland and Antarctica to melt at an accelerated pace. Scientists also believe melt water from above and seawater from below is seeping beneath Greenland's and West Antarctica's ice sheets, effectively lubricating ice streams and causing them to move more quickly into the sea. Higher sea temperatures are causing the massive ice shelves that extend out from Antarctica to melt from below, weaken, and break off.

    Apart from the above there is evidence that this has happened before in the Earths cycle but this was kept in check due to no human interference making things far worse. 

Sea levels stabilized around 4,000 years ago. From Shakun 2015:
New study finds sea level rise accelerating 

The rate of global sea level rise has been accelerating in recent decades, rather than increasing steadily, according to a new study based on 25 years of NASA and European satellite data. The new research suggests he world’s oceans will be on average at least 60cm higher by the end of the century.
Satellite observations show sea levels rising, and climate change is accelerating it.

Sea level rise is happening now, and the rate at which it is rising is increasing every year, according to a study released Monday in the Proceedings of the National Academy of Sciences.

Researchers, led by University of Colorado-Boulder professor of aerospace engineering sciences Steve Nerem, used satellite data dating to 1993 to observe the levels of the world's oceans.Using satellite data rather than tide-gauge data that is normally used to measure sea levels allows for more precise estimates of global sea level, since it provides measurements of the open ocean.

- Brandon Miller, CNN, Feb 12, 2017


NOAA: Sea level has been rising over the past century, and the rate has increased in recent decades. In 2016, global sea level was 3.2 inches (82 mm) above the 1993 average—the highest annual average in the satellite record (1993-present).


There was a huge climate report out just now from the USA:

The report was peer reviewed by the National Academy of Sciences.You know, the academy founded by Abraham Lincoln.They have 200 Nobel Prize winners among their members.

Global mean sea level (GMSL) has risen by about 7–8 inches (about 16–21 cm) since 1900, with about 3 of those inches (about 7 cm) occurring since 1993 (very high confidence). Human-caused climate change has made a substantial contribution to GMSL rise since 1900 (high confidence).

Slangen et al 2016, Human activities are the dominant contribution to SLR since 1970. Anthropogenic forcing dominates global mean sea-level rise since 1970 "the anthropogenic forcing (primarily a balance between a positive sea-level contribution from GHGs and a partially offsetting component from anthropogenic aerosols) explains only 15 ± 55% of the observations before 1950, but increases to become the dominant contribution to sea-level rise after 1970 (69 ± 31%), reaching 72 ± 39% in 2000 (37 ± 38% over the period 1900–2005)"

Takeaways:
1. Although natural variations in radiative forcing affect decadal trends, they have little effect over the twentieth century as a whole
2. In 1900, sea level was not in equilibrium with the twentieth-century climate, and there is a continuing, but diminishing, contribution to sea-level change from this historic variability
3. The anthropogenic contribution increases during the twentieth century, and becomes the dominant contribution by the end of the century. Our twentieth-century number of 37 ± 38% confirms the anthropogenic lower limit of 45%
4. Our results clearly show that the anthropogenic influence is not just present in some of the individual contributors to sea-level change, but actually dominates total sea-level change after 1970
Ice melt, sea level rise and superstorms: evidence from paleoclimate data, climate modeling, and modern observations that 2 °C global warming could be dangerous.

https://www.atmos-chem-phys.net/16/3761/2016/   


NASA følger havnivået her


The rise in sea levels seen over the past century is unmatched by any period in the past 6,000 years, according to a lengthy analysis of historical sea level trends.Anthropogenic forcing dominates global mean sea-level rise since 1970.

The reconstruction of 35,000 years of sea level fluctuations finds that there is no evidence that levels changed by more than 20cm in a relatively steady period that lasted between 6,000 years ago and about 150 years ago. This makes the past century extremely unusual in the historical record, with about a 20cm rise in global sea levels since the start of the 20th century. Scientists have identified rising temperatures, which have caused polar ice to melt and thermal expansion of the sea, as a primary cause of the sea level increase.

A two-decade-long collection of about 1,000 ancient sediment samples off Britain, north America, Greenland and the Seychelles formed the basis of the research, led by the Australian National University and published in PNAS.

Det er ingen "pause" i oppvarming som uttrykkes i form av havnivåstigningen. Havnivået stiger fordi varmere vann utvider seg og trenger mer plass, og fordi vannet fra is som smelter (på Grønland og Antarktis) er med på å øke volumet. Havet tar til seg mesteparten av den ekstra varmen som den økte drivhuseffekten skaper.

Sea level rise is caused primarily by two factors related to global warming: the added water from melting ice sheets and glaciers and the expansion of sea water as it warms. The first graph tracks the change in sea level since 1993 as observed by satellites.

The most respected reconstruction of global sea level during that time based on the global network of tide gauges is from Church & White:

cw20th
A plot of the PSMSL tide-gauge station data aggregated into a GMSL data set by Church & White [1]. There are significant changepoints at around 1934 and 2000, with the slope of the most recent segment being 4.1 mm/yr. (This is fairly consistent with Yi et al. 2015 [2], which finds that since 2010 global mean sea level "has been rising at a rate of 4.4 ± 0.5mm/yr for more than 3 years, due to an increase in the rate of both land ice loss and steric change.") Since there's a temporal increase in the rate of SLR for each segment, SLR is accelerating in this data set.

1. Church JA and White NJ: Sea-level rise from the late 19th to the early 21st century. Surveys in Geophysics 32(4–5):585–602, 2011. dx.doi.org/10.1007/s10712-011-9119-1

2. Yi S, Sun W, Heki K, Qian A: An increase in the rate of global mean sea level rise since 2010. Geophysical Research Letters 42(10):3998–4006, 2015. dx.doi.org/10.1002/2015GL063902


Huge Arctic report ups estimates of sea-level rise

The Arctic is warming more than twice as fast as the rest of the planet, suggests a huge assessment of the region. The warming is hastening the melting of Arctic ice and boosting sea-level rise.

http://www.climatecentral.org/gallery/graphics/global-sea-level-rise-by-century


Sea level rise isn’t just happening, it’s getting faster. Se rapporten her.

For ordens skyld; havnivået kan variere regionalt/lokalt"

Sea level rise at specific locations may be more or less than the global average due to local factors: subsidence, upstream flood control, erosion, regional ocean currents, and whether the land is still rebounding from the compressive weight of Ice Age glaciers."

IPPC:

FAQ 13.1 | Why Does Local Sea Level Change Differ from the Global Average? Shifting surface winds, the expansion of warming ocean water, and the addition of melting ice can alter ocean currents which, in turn, lead to changes in sea level that vary from place to place. Past and present variations in the distribution of land ice affect the shape and gravitational field of the Earth, which also cause regional fluctuations in sea level. Additional variations in sea level are caused by the influence of more localized processes such as sediment compaction and tectonics.


Bonus: Maldivene

In terms of the Maldives and sea level rise, it is nevertheless a bit special, and about how much dry land there is; no direct consequence of the sea level. Since the islands consist largely of coral, what goes too far up the sea will weather and erode away if the sea is sinking / the land rises, and when the sea rises / the land is sinking, the corals will grow and "fill up". So in the long run, such islands will be "just above sea level". The problem is if the water rises "too fast" and "we" at the same time have built cities and roads and airports and so on.

https://www.climatehotmap.org/global-warming-locations/republic-of-maldives.html


There is nothing in this study which is new nor in conflict with AGW theory or sea level rise.

http://sci-hub.tw/10.1002/wcc.557?fbclid=IwAR3xgUFL1Hvf_TjwxH-kYMj8DIg3tpnmqwpAJp-GLmoHaEKmaI0cHTo27ZA

Its all old news. Science have good understanding about atoll islands. Its science in progress.

Small atoll islands may grow, not sink, as sea levels rise:

https://www.newscientist.com/article/dn27639-small-atoll-islands-may-grow-not-sink-as-sea-levels-rise/

Atoll islands are more dynamic then we realized....it seems. They don't disprove sea rise, but it does broaden our thinking about how sea rise.

https://phys.org/news/2018-02-pacific-nation-bigger.html?fbclid=IwAR1HmhtCaMZQYLMwy_dWU-nFteELhHwj2kmpa2xUG65D_lW_xxSuHhPRmsQ

Havet blir surere.

Verdenshavene blir surere. De siste 200 årene har gjennomsnittlig surhet i havoverflaten økt med 26 prosent på verdensbasis, og Arktis er spesielt utsatt for forsuring. Norske havområder er spesielt utsatt for havforsuring, særlig lengst i nord.  


Årsaken er blant annet at kaldt vann kan ta opp mer CO2 enn varmere vann, og at tilførsler av ferskvann fra elver og issmelting svekker havets evne til å nøytralisere forsuringen. Pågående klimaendringer i form av økt nedbør, økt avrenning med elver og økt issmelting, vil i tillegg kunne forsterke sårbarheten og ytterligere redusere havets motstandskraft mot forsuring.

Mer CO2 i norske havområder enn før. Overvåking av pH og oppløst CO2 i norske havområder viser at innholdet av CO2 øker. Dette skyldes at de menneskeskapte utslippene av CO2 har økt, og at det er mer CO2 i atmosfæren enn tidligere. Det antas at havet hittil har tatt opp 50 prosent av alle menneskeskapte CO2-utslipp. På grunn av forsuringen er havets evne til å ta opp CO2 redusert, så i dag regner en at havet tar opp 25 prosent av de menneskeskapte utslippene. 

Tilbake til den store rapporten som var peer reviewed av the National Academy of Sciences.
Fourth National Climate Assessment (NCA4), Volume I 

The world’s oceans are currently absorbing more than a quarter of the CO2 emitted to the atmosphere annually from human activities, making them more acidic (very high confidence)  


Predatory journal list

In Scientific Publishing, Predatory publishing , also write-only publishing or deceptive publishing, is an exploitative academic publishin...