onsdag 28. mars 2018

If even oil companies accept human-caused global warming, why doesn’t everybody?

Its over. Climate change skeptics have outlived their usefulness to the fossil fuel industry.

Even oil companies agree on the science now. Just a few more to go.

http://oilandgasclimateinitiative.com/

Just like tobacco fought the science on the dangers of tobacco smoking. Oil companies and their front groups and think tanks and their echo chamber denier blogs and their amateur deniers, have fought hard for 30 years to legitimize the right to pollute for oil, gas and coal companies, and to argue for ever more tax cuts for the free marked fundamentalists who created them so they can continue to make shitloads of money by ruining public health and add to the damages of CC.

Private corporations take the profit while the environment and the public takes the bill. But its over now. Even oil companies agree on the science now. Those of you who keep trying to muddy the waters will be like those Japanese soldiers left behind after WW2 - not knowing that the war was over.

Amateur deniers are on their own. With their own petty self interests, free marked fundamentalist egoism justified by conspiracies, paranoia and alternative realities. Time to pop the bubble? Time to turn your back on front groups exploiting your cognitive biases? Front groups which undermine the dangers of tobacco smoking on the same pages where they deny agw?


If even oil companies accept human-caused global warming, why doesn’t everybody?

In a California court case this week, Judge William Alsup asked the two sides to provide him a climate science tutorial.
The plaintiffs are the coastal cities of San Francisco and Oakland. They’re suing five major oil companies (Chevron, ExxonMobil, Shell, ConocoPhillips and BP) to pay for the cities’ costs to cope with the sea level rise caused by global warming. Chevron’s lawyer presented the science for the defense, and most notably, began by explicitly accepting the expert consensus on human-caused global warming, saying:

From Chevron’s perspective, there is no debate about the science of climate change
https://www.theguardian.com/environment/climate-consensus-97-per-cent/2018/mar/23/in-court-big-oil-rejected-climate-denial?CMP=share_btn_fb 


Judge dismisses Exxon lawsuit against climate change probe 

CHEVRON’S LAWYER, SPEAKING FOR MAJOR OIL COMPANIES, SAYS CLIMATE CHANGE IS REAL AND IT’S YOUR FAULT


torsdag 8. mars 2018

MYTH #20 CO2 IS "PLANT FOOD" / ONLY A TRACE GAS

CO2 ER JO BARE PLANTEFOR, OG SÅ LITEN DEL AV ATMOSFÆREN, ER DET SÅ FARLIG OM DET BLIR MER AV DET?
There are some positive short termed effect to increased CO2 in the atmosphere for some plants, but the added warming cancels it out, and the net impact is very likely negative, especially in the future. Weeds benefits faster from more C02. Biodiversity, insects and oxygen producing phytoplankton in the oceans are already effected by global warming. Farmers world wide are hit hard by floods and drougts. They need stability for their crops/harvest, not a rapidly warming world.
Negatives from more C02:
  1. The added heat cancels out any short termed positive effect for some of the plants. A 20 years study of crops grown under enhanced CO2 finds that there is an upper limit to C3 enhancement from CO2, while C4 plants, after a sufficient length of time, adapt to high CO2 by improving their uptake of nitrogen. So: Increased CO2 ultimately depresses C3 growth, while C4 plants, which include numerous pest varieties, will become more vigorous. The net result is depressed food production.
  2. Weeds benefits faster from more C02
  3. Biodiversity is already affected by GW
  4. Insects and their habitats are already affected by pollutions and CC
  5. Oxygen producing phytoplankton in the oceans are already effected by global warming.
  6. Farmers world wide are hit hard by floods and drougts. Natural Disasters Are Costing Farming Billions of Dollars a Year
  7. Greening the earth adds to the land albedo effect and is amplifying global warming
  8. Increased carbon dioxide levels in air restrict plants' ability to absorb nutrients
  9. Plant quality declines as CO2 levels rise
  10. Climate change happening 'too fast' for plant and animal species to adapt
  11. CO2 enhanced plants will need extra water both to maintain their larger growth as well as to compensate for greater moisture evaporation as the heat increases. Where will it come from? In many places rainwater is not sufficient for current agriculture and the aquifers they rely on are running dry throughout the Earth.
In sub-Saharan Africa, a much higher risk of droughts will lead to insufficient access to drinking and irrigation water, and reduced agricultural productivity.
Ask the Experts: Does Rising CO2 Benefit Plants?
Climate change’s negative effects on plants will likely outweigh any gains from elevated atmospheric carbon dioxide levels.
A lack of nitrogen or other nutrients does not affect agricultural plants as much as wild ones, thanks to fertilizer. Still, research shows plants “get some benefits early on from higher CO2, but that [benefit] starts to saturate” after the gas reaches a certain level, Moore says—adding, “The more CO2 you have, the less and less benefit you get.” And while rising carbon dioxide might seem like a boon for agriculture, Moore also emphasizes any potential positive effects cannot be considered in isolation, and will likely be outweighed by many drawbacks. “Even with the benefit of CO2 fertilization, when you start getting up to 1 to 2 degrees of warming, you see negative effects,” she says. “There are a lot of different pathways by which temperature can negatively affect crop yield: soil moisture deficit [or] heat directly damaging the plants and interfering with their reproductive process.” On top of all that, Moore points out increased CO2 also benefits weeds that compete with farm plants.


Greening the earth adds to the land albedo effect;

As the land warms up, trees and forests migrate north. White snow that reflects sunlight back to space is covered with dark green leaves or dark brown tree trunks and branches, which absorb sunlight and convert it to heat, with the same effect of amplifying global warming.

Darkening the earth's albedo is a very bad idea right now.

https://www.bloomberg.com/news/articles/2018-03-15/natural-disasters-are-costing-farming-billions-of-dollars-a-year

Crop failure and bankruptcy threaten farmers as drought grips Europe


The "C02 is good for plants" argument debunked:

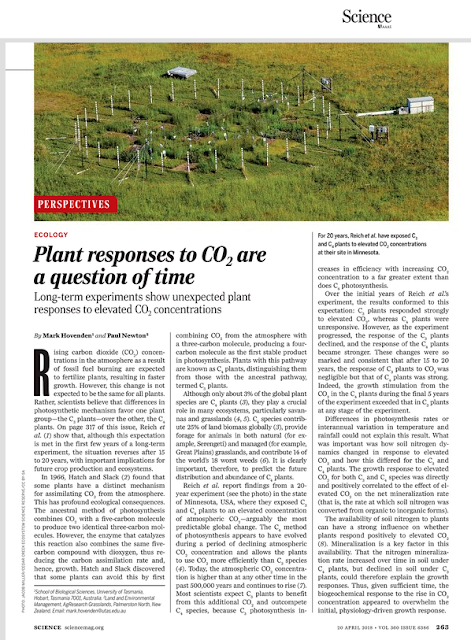
Two major groups of plants have shown a surprising reversal of fortunes in the face of rising levels of carbon dioxide in the atmosphere.

During a 20-year field experiment in Minnesota, a widespread group of plants that initially grew faster when fed more CO2 stopped doing so after 12 years, researchers report in the April 20 Science.

The assumption has been that C3 crops are helped by higher CO2 levels while C4 plants (grasses, weeds, some grains) are hurt because of the unfavorable CO2 - nitrogen mix. However, a 20 years study of crops grown under enhanced CO2 finds that there is an upper limit to C3 enhancement from CO2, while C4 plants, after a sufficient length of time, adapt to high CO2 by improving their uptake of nitrogen. So: Increased CO2 ultimately depresses C3 growth, while C4 plants, which include numerous pest varieties, will become more vigorous. The net result is depressed food production.


Climate Change Is Becoming a Top Threat to Biodiversity

Warming rivals habitat loss and land degradation as a threat to global wildlife


Worrying the Facts Versus Challenging the (Hidden) Premise

The CO2-Is-Plant-Food argument, at least as used by conservative climate skeptics, has two parts. The first is the “scientific” claim that CO2 is good for plants. The second is the policy implication: therefore, CO2 should not be regulated so as to slow or reverse its increase. But the implication only seems to follow from the claim. To actually get to this policy, one must also assume a broader rule or premise: things that are good for plants are not regulated.

Increased carbon dioxide levels in air restrict plants' ability to absorb nutrients


Er mer C02 i atmosfæren nødvendigvis bra for plantelivet?

Such claims fail to take into account that increasing the availability of one substance that plants need requires other supply changes for benefits to accrue. It also fails to take into account that a warmer earth will see an increase in deserts and other arid lands, reducing the area available for crops. Plants cannot live on CO2 alone; a complete plant metabolism depends on a number of elements. [...] CO2 enhanced plants will need extra water both to maintain their larger growth as well as to compensate for greater moisture evaporation as the heat increases. Where will it come from? In many places rainwater is not sufficient for current agriculture and the aquifers they rely on are running dry throughout the Earth.
Faktasjekkeren FactCheck.org viser til at de negative sidene er langt flere enn de positive ved et høyere C02 nivå. Spesielt i fremtiden.Increasedwater-use efficiency does not lead to enhanced tree growth under xeric andmesic conditions Lévesque, M, Siegwolf, R., Saurer, M., Eilmann, B. and Rigling, A. (2014), Increased water-use efficiency does not lead to enhanced tree growth under xeric and mesic conditions. New Phytol, 203: 94–109. doi:10.1111/nph.12772


Here is one example as to how deniers are clueless when they spew out this "c02 is plant food" nonsense. Most of the oxygen we breed comes from plankton in the oceans.

Scientists believe that phytoplankton contribute between 50 to 85 percent of the oxygen in Earth’s atmosphere.

Researchers at Canada's Dalhousie University say the global population of phytoplankton has fallen about 40 percent since 1950. This is caused by AGW:

They believe that rising sea temperatures are driving the decline. As surface water warms, it tends to form a distinct layer that does not mix well with cooler, nutrient-rich water below, depriving phytoplankton of some of the materials they need to turn CO2 and sunlight into energy.

https://www.scientificamerican.com/article/phytoplankton-population/

http://earthsky.org/earth/how-much-do-oceans-add-to-worlds-oxygen


The right combination of warm water, high nutrient levels, and adequate sunlight combined can cause a harmful algae bloom.

http://www.climatecentral.org/gallery/graphics/algae-blooms-and-climate-change


Plant quality declines as CO2 levels rise

Another study published in Nature Climate Change last week concluded that higher temperatures will cause wheat production to decline. Just a 1°C rise in global temperature will decrease wheat yields by about 5% (approximately 35 million tons).

Climate change is bad news for several of our staple crops. For example, a 2012 paper found that higher temperatures are detrimental to French corn yields. While French corn production has increased steadily in recent decades due to a combination of technological improvements and CO2 fertilization (the former far more than the latter), yields have leveled off in recent years, and were particularly low when struck by heat waves.

There will certainly be some positive climate change outcomes as well, but all evidence suggests the negatives will far outweigh the positives. Cherry picking one possible positive outcome and ignoring all the negatives as an excuse to maintain the status quo is simply a failure of basic risk management. And with a threat as dangerous as global climate change, engaging in proper risk management is incredibly important. Failure is simply not an option.

A new study by scientists at Stanford University, published in the Proceedings of the National Academy of Sciences, tested whether hotter temperatures and higher carbon dioxide levels that we’ll see post-2050 will benefit the kinds of plants that live in California grasslands. They found that carbon dioxide at higher levels than today (400 ppm) did not significantly change plant growth, while higher temperatures had a negative effect.The Stanford scientists set up 132 plots of flowers and grass in California and introduced varying levels of carbon dioxide, temperature, water, and nitrogen. The scientists conducted the experiments over 16 growing seasons between 1998 and 2014. They found that only higher nitrogen levels resulted in higher plant productivity, while higher temperatures caused it to decline.

Enda flere studier påpeker at de negative sidene med mer CO2 er betydeligere enn de "positive":


Co-author Dr Philippe Ciais, from the Laboratory of Climate and Environmental Sciences in Gif-sur‑Yvette, France (also an IPCC author), said: "The fallacy of the contrarian argument is two-fold. First, the many negative aspects of climate change are not acknowledged. "Second, studies have shown that plants acclimatise to rising CO2 concentration and the fertilisation effect diminishes over time." Future growth is also limited by other factors, such as lack of water or nutrients.


Hvem skal befrukte plantene hvis biene forsvinner?
Ifølge Det internasjonale Naturpanelet (IPBES) er tre fjerdedeler av verdens ledende jordbruksvekster avhengig av insektenes pollinering, for å få avling og kvalitet. En rapport fra Naturpanelet viser imidlertid at antall ville pollinerende arter har sunket flere steder, blant annet i det nordvestlige Europa.
Climate change on track to cause major insect wipeout, scientists warn
Abstract
In the Paris Agreement on Climate Change, the United Nations is pursuing efforts to limit global warming to 1.5°C, whereas earlier aspirations focused on a 2°C limit. With current pledges, corresponding to ~3.2°C warming, climatically determined geographic range losses of >50% are projected in ~49% of insects, 44% of plants, and 26% of vertebrates. At 2°C, this falls to 18% of insects, 16% of plants, and 8% of vertebrates and at 1.5°C, to 6% of insects, 8% of plants, and 4% of vertebrates. When warming is limited to 1.5°C as compared with 2°C, numbers of species projected to lose >50% of their range are reduced by ~66% in insects and by ~50% in plants and vertebrates.
http://science.sciencemag.org/content/360/6390/791

Insects are vital to ecosystems but will lose almost half their habitat under current climate projections.

A report from The Intergovernmental Science-Policy Platform on Biodiversity and Ecosystem Services (IPBES), concludes that 75% of our food crops and nearly 90% of wild flowering plants depend at least to some extent on animal pollination and that a high diversity of wild pollinators is critical to pollination even when managed bees are present in high numbers. 
More than 75 percent decline over 27 years in total flying insect biomass in protected areas.
Loss of insects is certain to have adverse effects on ecosystem functioning, as insects play a central role in a variety of processes, including pollination [1, 2], herbivory and detrivory [3, 4], nutrient cycling [4] and providing a food source for higher trophic levels such as birds, mammals and amphibians. For example, 80% of wild plants are estimated to depend on insects for pollination [2], while 60% of birds rely on insects as a food source [5]. The ecosystem services provided by wild insects have been estimated at $57 billion annually in the USA [6]. Clearly, preserving insect abundance and diversity should constitute a prime conservation priority.
Current data suggest an overall pattern of decline in insect diversity and abundance. For example, populations of European grassland butterflies are estimated to have declined by 50% in abundance between 1990 and 2011 [7]. Data for other well-studied taxa such as bees [814] and moths [1518] suggest the same trend. Climate change, habitat loss and fragmentation, and deterioration of habitat quality have been proposed as some of the prime suspects responsible for the decline.

It’s official. As tragically revealing as the move might be, the rusty patched bumble bee has now joined the grizzly bear, gray wolf, northern spotted owl, and some 700 others on the endangered species list — the first bee ever to garner those protections in the continental United States.

Once abundant in the grasslands and prairies in 31 states in the East and Midwest, the rusty patched bumble bee’s population has been decimated by as much as 95 percent by some estimates, and now exists only in isolated pockets in 12 states and the province of Ontario, Canada.


C02 ER "BARE" EN SPORGASS


Siden den industrielle revolusjon har mengden CO2 i atmosfæren økt fra 275 deler per milliondel luft til rett over 400 deler. Mennesker bidrar med 36 milliarder tonn C02 årlig til atmosfæren.

Karbonkretsløpet er bare i stand til å ta opp ca halvparten av dette, ca 18 millioner tonn blir altså værende i atmosfæren - hvert år.

CO2-konsentrasjonen har økt med 40% siden 1850. Dette er etter all sannsynlighet den høyeste konsentrasjon på 15-20 millioner år. En naturlig endring på 100 ppm, som vi har kunnet dokumentere gjennom iskjerneprøver, tar mellom 5000 og 20 000 år. Endringen vi nå observerer har skjedd på kun 120 år, et svært svært kort tidsrom i jordas levetid.

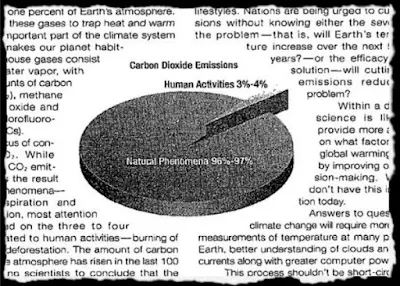
Vår venn potholer 54 debunker fornektermyten om at mennesker bare har bidratt med 3-4% av C02et i atmosfæren. 


That moment when even deniers nr 1 denier blog WUWT, admits the 3% number is false. Hilarious.


https://wattsupwiththat.com/2014/07/29/epa-document-supports-3-of-atmospheric-carbon-dioxide-is-attributable-to-human-sources/

Selv om våre utslipp bare er en liten del av karbonkretsløpet, kommer det altså i tillegg til det som allerede er der, og blir i atmosfæren i svært lang tid. Derfor øker nivåene, og dermed temperaturen. Drypper det fra kranen ned i badekaret ditt, selv om dette bare er en liten dråpe, vil det en likevel en vakker dag renne over.

Trace gas/plant food' CO2 IS also a greenhouse gas. Even though its atmospheric mixing ratio is just 0.04% or 400ppm, CO2 exerts a marked effect on the outflow of infrared radiation which is evident from the 'CO2' notch in the infrared power spectrum as seen from 'top of atmosphere', TOA, essentially from space!

The total mass of ozone in the atmosphere is about 3 billion metric tons. That may seem like a lot, but it is only 0.00006 percent of the atmosphere. Still, Ozone protects life on Earth from the Sun’s ultraviolet (UV) radiation.

The area bounded by the plot is proportional to the integral of the power spectrum, which is EQUAL to the total emitted IR power. This is a mathematical identity and not a matter of opinion. Anything which reduces the area under the plot, is reducing the total outflow of infrared radiation which we refer to as the 'greenhouse effect' we can even 'eyeball' the extent of the CO2 effect from the area of the CO2 notch which is about 130/cm across and 80mW/(m^2 sr cm^-1) tall i.e. 130 x 80 = 10,400mW/(m^2 sr) or 10.4W/(m^2 sr). We must multiply by pi to integrate over the total solid angle and we arrive at 32.6 W/m^2 .. the amount by which CO2 contributes to the total greenhouse effect (about 25%) which is also due to ozone, water vapour, clouds, methane, nitrous oxide and HFCs

Vi mennesker slipper ut 36 milliarder tonn med C02 hvert år. "CO2 utgjør 400 ppm (0,040%) av atmosfæren. Hvordan kan en så liten mengde være viktig? Poenget er dette: Hvor mye CO2 utgjør av atmosfæren er en sammenligning som ikke betyr så mye. Det er bare drivhusgassene som kan fange opp varmestråling. Det resten av atmosfæren bidrar med, er bare å overta varme fra CO2, vanndamp og co. når de først har fanget den opp.

Å si at CO2 "utgjør så lite" er som å si at arsenikk er "bare" en "ubetydelig" vannforurensning. Små mengder av svært aktive stoffer kan få store konsekvenser. (Jordkloden er heller ikke viktig forresten, den utgjør jo bare 3 ppm (0,003%) av solsystemets totale masse!).Klimafornektere liker å leke med disse størrelsene og tallene; 

Når C02 "bare" er "plantefor", finnes C02 over alt, har superkrefter , og det er ufattelige mengder av den for den er jo tross alt grunnen til at alle planter og trær på Jorden puster og lever. Planter, som alle dyr og mennesker, er helt avhengige av. Men, når C02 brukes for å forklare en økning i drivhuseffekten, da da er den plutselig blitt så liten, så ubetydelig og kraftløs.


When CO2 is "only plant food", C02 is everywhere, have super powers, and there are unimaginable amounts of it because it is the reason why all the plants and trees on Earth breathe and live. Plants, like all animals and humans, depend entirely on.

However, when CO2 is used to explain an increase in greenhouse effect, then it has suddenly become so small, so insignificant and powerless. So tiiiiiiiiny. Just a traaaaaace.


Hvor "ubetydelig" og "små" C02 og de andre ikke-kondenserende klimagassene er beskrives vel best slik:  

Uten CO2 og de andre ikke-kondenserende drivhusgassenes egenskap til å absorbere infrarød stråling, ville det jordbaserte drivhuset kollapse og kaste det globale klimaet inn i en isbundet tilstand. Uten drivhusgassene i atmosfæren ville middeltemperaturen på Jorden vært ned mot -18 grader celsius istedenfor + 15 grader celsius. 

Rekordhøy konsentrasjon Basert på målinger gjort i blant annet luftbobler forseglet dypt nede i isbreer på Grønland og i Antarktis, har forskere beregnet at CO2-konsentrasjonen for de siste flere hundre tusen år har bølget mellom cirka 180 og 300 ppm, men aldri oversteget 300 ppm. Noen forskere sier til og med at dagens nivå er det høyeste på hele 4 millioner år. Én ppm CO2 utgjør i atmosfæren cirka 7,81 milliarder tonn CO2. Får britiske Met Office rett i at konsentrasjonen øker med 2,5 ppm, vil det med andre ord være rundt 19,5 milliarder tonn mer CO2 i atmosfæren ved utgangen av 2017 enn ved starten. Den totale mengden CO2 i atmosfæren i dag er cirka tre tusen milliarder tonn, eller 3000 gigatonn om du vil – altså 400 ppm.

"Sammenhengen mellom økning av klimagasser og økende temperatur er klar: akkurat som blekk gjør vann mer farget, gjør CO2 atmosfæren mer absorberende. Det ekstra CO2et i atmosfæren vår fanger energi som ellers vil unnslippe til verdensrommet. Den målte globale oppvarmingen stemmer overens med mengden energi fanget fra drivhusgassene til atmosfæren. En fordobling av CO2 fra 280 ppm til 560 ppm er fortsatt "lite", men akkurat som med arsenikk, er forskjellen mellom lite "lite" og et større "lite" dødelig."

I løpet av de siste 10.000 årene har nivået av karbondioksid i atmosfæren holdt seg på relativt stabile nivåer. Men menneskelige CO2-utslipp de siste århundrene har opprørt denne balansen. Å fokusere på noen få positive virkninger av økt karbondioksid er å ignorere det bredere bildet av dets fulle virkninger.[...] Havene absorberer CO2 fra atmosfæren, det fører det til forsuring som påvirker mange marine økosystemer. [...] Imidlertid er den viktigste effekten av økende CO2 varmere temperaturer.

Pollution is not a measure of somethings make-up, it is about how much of it you have and where. Water is great in the sea. Not great when flooding your house.

The US supreme court ruled that carbon dioxide is a pollutant in a landmark 2007 case.


MY YOUTUBE DEBUNK ON THE ARTIC SEA ICE


https://goo.gl/9SXayo


First, the claims:


MY ANSWER:

Have you been to the echo chamber denier blogs now?

Is it WUWT or NoDickzone?

Found some studies you can misrepresent? Retard.

The studies you are linking to are saying that natural varabilities does play a role in warming regional areas as heat exchanges, but the main driver for GW is humans. This is nothing new.

None of your studies disproves AGW nor the fact that artic ice is a a record low as confirmed by the most comprehensive studies done on the matter + satelites.

Your attempt at claiming its ONLY natural varabilities at play is not supported by the studies nor by the authors of the studies.

Lets have a closer look AND hear from the authors themselves.


1. YOUR STUDY

Holocene variability in sea ice cover, primary production, and Pacific-Water inflow and climate change in the Chukchi and East Siberian Seas (Arctic Ocean)

http://onlinelibrary.wiley.com/doi/10.1002/jqs.2929/abstract

Chukchi and East Siberian Seas is local and does not represent all of the artic. Anyway, anomalies are quite common as heat moves around and local albeidos can and will make an impact.

The study is only talking about these local varabilities (marginal seas) in Chukchi and East Siberian Seas and never claims what you try to make it claim. It says:

"The biomarker proxy records show (i) minimum sea ice extent during the Early Holocene, (ii) a prominent Mid-Holocene short-term high-amplitude variability in sea ice, primary production and Pacific-Water inflow, and (iii) significantly increased sea ice extent during the last ca. 4.5k cal a BP. This Late Holocene trend in sea ice change in the Chukchi and East Siberian Seas seems to be contemporaneous with similar changes in sea ice extent recorded from other Arctic marginal seas .

In another study by the same lead author, Ruediger Stein, he DOES talk about artic sea ice:

"Coinciding with global warming, Arctic sea ice has rapidly decreased during the last four decades and climate scenarios suggest that sea ice may completely disappear during summer within the next about 50–100 years."

https://www.nature.com/articles/s41467-017-00552-1

___________________________________________________________

2. YOUR STUDY:

Tropical forcing of the recent rapid Arctic warming in northeastern Canada and Greenland

https://www.nature.com/articles/nature13260

“A substantial portion of recent warming in the northeastern Canada and Greenland sector of the Arctic arises from unforced natural variability.”

They are wondering about why GW is not uniform and why there is a "hot spot" in Greenland

"The natural variations in the new study related to an unusually warm western tropical Pacific, near Papua New Guinea. Since the mid-1990s the water surface there has been about 0.3 degrees hotter than normal. Computer models show this affects the regional air pressure, setting off a stationary wave in the atmosphere that arcs in a great circle from the tropical Pacific toward Greenland before turning back over the Atlantic."

"Along this wave train there are warm spots where the air has been pushed down, and cold spots where the air has been pulled up," Wallace said. "And Greenland is in one of the warm spots."

So for these two "hot spot" locations only, the study concludes:

"Up to half of the recent warming in Greenland and neighboring parts of the Canadian Arctic may be due to climate variations that originate in the tropical Pacific and are not connected with the overall warming of the planet. The other portion is likely due to global warming."

https://www.sciencedaily.com/releases/2014/05/140507132657.htm

_______________________________________

3. YOUR STUDY:

Influence of high-latitude atmospheric circulation changes on summertime Arctic sea ice

https://www.nature.com/articles/nclimate3241

"Internal variability dominates the Arctic summer circulation trend and may be responsible for about 30–50% of the overall decline in September sea ice since 1979."

THATS SUMMER ICE only . DO YOU KNOW WHAT THIS MEANS?

IT MEANS THAT ALL  ICE TO HAVE DISAPEARED SINCE 1979, BUT FOR MAYBE 30% OF THE SUMMER ICE, IS DUE TO AGW!!

The first author of the study,  Qinghua Ding,  confirms this:

Anthropogenic forcing is still dominant — it’s still the key player,” said first author Qinghua Ding, a climate scientist at the University of California Santa Barbara who holds an affiliate position at the UW.

http://www.washington.edu/news/2017/03/13/rapid-decline-of-arctic-sea-ice-a-combination-of-climate-change-and-natural-variability/

SCIENTIST KNOWS ABOUT THIS, THERE IS NOTHING NEW HERE:
“The idea that natural or internal variability has contributed substantially to the Arctic sea ice loss is not entirely new,” said second author Axel Schweiger, a University of Washington polar scientist who tracks Arctic sea ice. “This study provides the mechanism, and uses a new approach to illuminate the processes that are responsible for these changes.”

YOU ARE CONFIRMING THAT HUMANS ARE THE MAIN DRIVER FOR CLIMATE CHANGE
_______________________________________________

4. This only shows that you dont read the studies, you only copy and paste from denier blogs. If you had read this one, you would not post it here, because it makes it 100% clear that humans are causing rapid CC in the artic:

YOUR STUDY

Holocene dynamics in the Bering Strait inflow to the Arctic and the Beaufort Gyre circulation based on sedimentary records from the Chukchi Sea

https://www.clim-past.net/13/1111/2017/cp-13-1111-2017.pdf

Abstract:
"The Arctic currently faces rapid climate change caused by global warming (e.g., Screen and Simmonds, 2010; Harada, 2016). Changes in the current system of the Arctic Ocean regulate the state of Arctic sea ice and are involved in global processes via ice albedo feedback and the delivery of freshwater to the North Atlantic Ocean (Miller et al., 2010; Screen and Simmonds, 2010). The most significant consequence of this climate change during recent decades is the retreat of summer sea ice in the Pacific sector of the Arctic (e.g., Shimada et al., 2006; Harada, 2016, and references therein)"

"Increased concentrations of atmospheric greenhouse gases have driven Arctic and global average warming,"

Screen and Simmonds, 2010
https://www.nature.com/articles/nature09051

________________________________________________________

5. YOUR STUDY

Glacier mass balance: the first 50 years of international monitoring

http://journals.sagepub.com/doi/abs/10.1191/0309133302pp326ra

THIS STUDY, WHICH IS VEEERY LIMITED,  IS NOT RELATED TO THE ARTIC, AS IT CLEARLY STATES

The paper reviews measurements of glacier mass balance in the period 1946-95. There are data for 246 glaciers but most records are quite short. The available mass-balance data are biased to Western Europe, North America and the former USSR with too few measurements from other parts of the world.

_________________________________________________________________

SUMMARY

NONE OF YOUR STUDIES DISPROVES THE RECORD LOW ARTIC SEA ICE AND THE FACT HUMANS ARE THE MAIN DRIVER FOR GW

We need to look at the wider picture, and scientist have.

Arctic land and sea ice loss observed in the last three decades continues, in some cases accelerating (very high confidence).

https://science2017.globalchange.gov/chapter/11/

"Sea ice loss "is beyond the range of natural variability, implying a human component to the drastic decrease observed in the records."

"This time series shows the Arctic sea ice extent in millions of square kilometers over the past roughly 1,500 years.


https://www.climate.gov/news-features/featured-images/2017-arctic-report-card-sea-ice-melting-unprecedented-least-1500-years


"Arctic temperatures are rising faster than the global average. The Arctic was warmer from 2011 to 2015 than at any time since instrumental records began in around 1900, and has been warming more than twice as rapidly as the world as a whole for the past 50 years. January 2016 in the Arctic was 5°C warmer than the 1981–2010 average for the region, a full 2°C higher than the previous record set in 2008, and monthly mean temperatures in October through December 2016 were 6°C higher than average for these months. Sea temperatures are also increasing, both near the surface and in deeper water"

http://www.amap.no/documents/doc/Snow-Water-Ice-and-Permafrost.-Summary-for-Policy-makers/1532

"The annual mean Arctic sea-ice extent decreased over the period 1979 to 2012, with a rate that was very likely in the range 3.5 to 4.1% per decade. Arctic sea-ice extent has decreased in every season and in every successive decade since 1979, with the most rapid decrease in decadal mean extent in summer (high confidence).

http://ar5-syr.ipcc.ch/topic_summary.php


More statuses on sea ice from NOAA, NASA etc:


https://nsidc.org/arcticseaicenews/2016/12/arctic-and-antarctic-at-record-low-levels/

https://www.snopes.com/fact-check/does-arctic-ice-doubt-reality-climate-change/

https://www.nasa.gov/feature/goddard/2017/sea-ice-extent-sinks-to-record-lows-at-both-poles

http://onlinelibrary.wiley.com/doi/10.1002/2017JC012768/full


http://psc.apl.uw.edu/research/projects/arctic-sea-ice-volume-anomaly/


onsdag 7. mars 2018

UPDATE: 2018 TEMPERATURES and OTHER CLIMATE NEWS


February 2018 was sixth warmest February on record.

https://climate.nasa.gov/news/2694/february-2018-was-sixth-warmest-february-on-record/


January 2018 was the fifth warmest January in 138 years of modern record-keeping, according to scientists at Goddard Institute for Space Studies.

The modern global temperature record begins around 1880 because previous observations didn't cover enough of the planet. The current monthly analysis is assembled by NASA scientists who analyze temperature data from about 6,300 meteorological stations, ship- and buoy-based sea surface temperature measurements, and Antarctic research stations.

https://go.nasa.gov/2BtWdoW


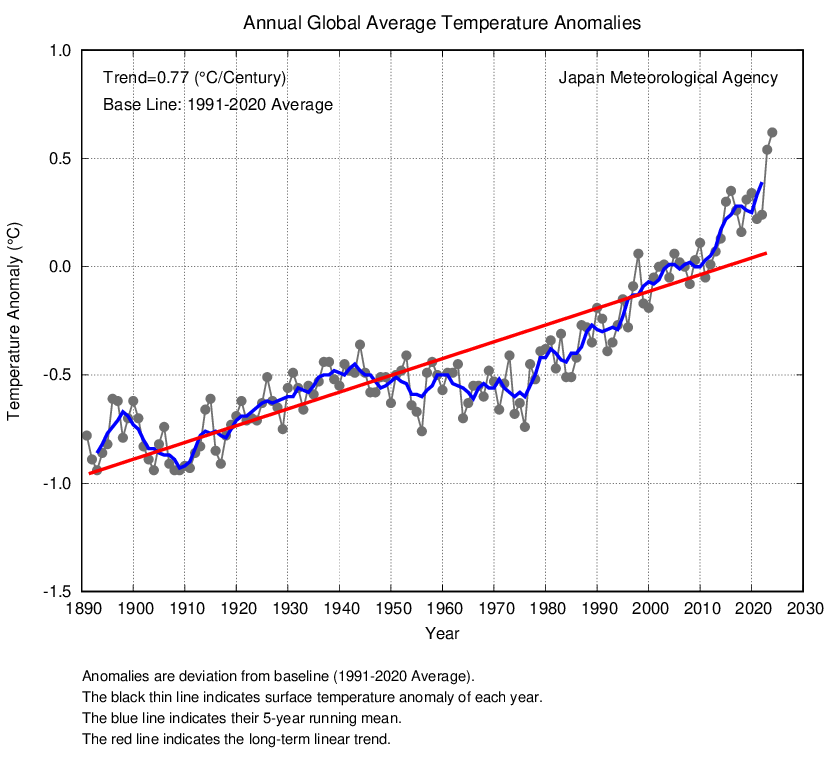
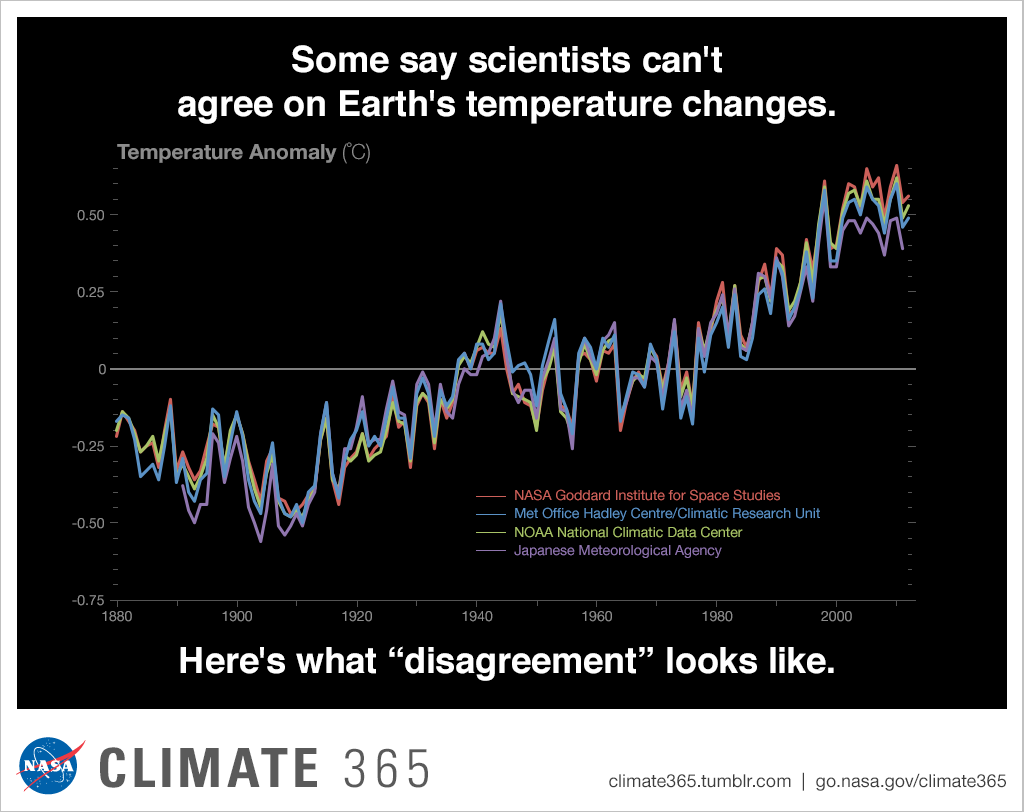
Japans mets temperature trend correlate with all the other available datasets:

http://ds.data.jma.go.jp/tcc/tcc/products/gwp/temp/ann_wld.html

https://www.giss.nasa.gov/research/features/201501_gistemp/

https://static.skepticalscience.com/pics/temp_disagreements.png


________________________________________________________

New study brings Antarctic ice loss into sharper focus

A NASA study based on an innovative technique for crunching torrents of satellite data provides the clearest picture yet of changes in Antarctic ice flow into the ocean. The findings confirm accelerating ice losses from the West Antarctic Ice Sheet and reveal surprisingly steady rates of flow from its much larger neighbor to the east.

The computer-vision technique crunched data from hundreds of thousands of NASA-U.S. Geological Survey Landsat satellite images to produce a high-precision picture of changes in ice-sheet motion.

"Including modeled rates of snow accumulation and basal melt, the Antarctic ice sheet lost ice at an average rate of 183 ± 94 Gt yr−1 between 2008 and 2015."

https://climate.nasa.gov/news/2686/new-study-brings-antarctic-ice-loss-into-sharper-focus/

https://www.the-cryosphere.net/12/521/2018/tc-12-521-2018-discussion.html

https://www.theguardian.com/world/2018/mar/06/arctic-warmest-winter-record-climate-change


fredag 2. mars 2018

Comparing CMIP5 & observations

For anyone interested in how well climate model projections have been doing compared to observations of global surface temperatures, here’s a recent update (21st February) incorporating 2017 data from Prof. Ed Hawkins, climatologist at the University of Reading.

The short takehome is that the model projections ran high for a bit in the first part of the century, but observations have caught up in the last few years. In other words, the models are working well at what they’re designed to do. The data contradict a core ‘skeptic’ talking point about the utility of climate models.

The typical talking points criticizing models involves cherrypicking intervals, comparing apples to oranges (comparing the surface temperatures with which the models are input with and output to satellite data), asking models to perform tasks they’re not designed for (projecting external forcings like volcanic eruptions or short-term variation), or using incorrect baselines.

These talking points have become much harder to defend with science in recent years, although they remain prominent in political rhetoric.

This page is an ongoing effort to compare observations of global temperature with CMIP5 simulations assessed by the IPCC 5th Assessment Report. The first two figures below are updated versions of Figure 11.25a,b from IPCC AR5 which were originally produced in mid-2013.

The first panel shows the raw ‘spaghetti’ projections, with different observational datasets in black and the different emission scenarios (RCPs) shown in colours. The simulation data uses spatially complete coverage of surface air temperature.


The attached plot shows combined CMIP5 TAS land-only and TOS sea-surface temperature simulations, à la Cowtan et al. 2015 [1], to global instrumental land + sea-surface temperatures. I've reproduced the model runs in [1] in a simpler way (by averaging paired TAS land + TOS runs weighted by the global proportions of land and water, 0.28 and 0.72), but with very similar results, and for all four RCP scenarios. As you can see in the plot (comparable to Figure 4a of [1]), an apples-to-apples comparison of instrumental land+SSTs to combined CMIP5 TAS+TOS realizations comes out pretty well for the models.

I keep a simpler version of this plot (RCP 8.5 only, since the CMIP5 scenarios don't really diverge till after about 2020) updated biweekly here, if anyone cares to check the models' skill that often:

https://github.com/priscian/climeseries


CMIP5 RCP 8.5 TAS + TOS scenario realizations compared to the major land+SST series.

  [References]

1. Cowtan K, Hausfather Z, Hawkins E, Jacobs P, Mann ME, Miller SK, Steinman BA, Stolpe MB, and Way RG: Robust comparison of climate models with observations using blended land air and ocean sea surface temperatures. Geophysical Research Letters 42(15):6526–34, 2015.


http://onlinelibrary.wiley.com/doi/10.1002/2015GL064888/abstract;jsessionid=D489A1BDC64FF15EDAE761E70B6584AF.f02t03


Debunking the Caterpillar meme

  To sum up again, this time with the correct numbers: the ICE will still produce 160,000 * 150 = 24 tons of CO 2 the electric car will prod...