AGW.
The "idea" that, even after 150 years and billions of data points filtered through the scientific method, and based upon the principles of basic physics, top climate scientist and the tens of thousands of peer reviewed papers they'd written, had to put AGW theory to rest because they.....had... never... heard... of.. the.. (elephant in the room), the... so ...called... Little Ice Age...before an amateur denier tipped them about in a facebook thread.

The Little Ice Age is often cited by climate change deniers as proof humans are not causing global warming. The theory goes that Earth is naturally coming out of a period of coolness, and thus the changes in global temperature are merely coincidental.
We’ve known for a while that argument is essentially crap. But now a new study has further cemented its crapness by discovering that the Little Ice Age was almost insignificant, and cannot account for modern temperature increases.
This was a modestly cool period running from about the year 1300 to 1850. It was particularly cold in the UK, where the River Thames sometimes froze over, and ‘frost fairs’ were held.
https://www.theguardian.com/environment/climate-consensus-97-per-cent/2018/jan/09/the-imminent-mini-ice-age-myth-is-back-and-its-still-wrong
The main drivers of the Little Ice Age cooling were decreased solar activity and increased volcanic activity. These factors cannot account for the global warming observed over the past 50-100 years. Furthermore, it is physically incorrect to state that the planet is simply "recovering" from the Little Ice Age.
What ended the Little Ice Age?
Study on the Little Ice Age: Low solar activity just marginally cools the climate.
Abrupt onset of the Little Ice Age triggered by volcanism and sustained by sea‐ice/ocean feedbacks
https://agupubs.onlinelibrary.wiley.com/doi/full/10.1029/2011GL050168
The weakening sun was not the determinant factor for the Little Ice Age. Strong volcanic eruptions in particular, but also a smaller amount of greenhouse gases in the atmosphere were important factors during this period of cooler climate in the 16th and 17th century, a new study shows.
Impact of Volcanic Eruptions on Decadal to Centennial Fluctuations of Arctic Sea Ice Extent during the Last Millennium and on Initiation of the Little Ice Age
https://journals.ametsoc.org/doi/abs/10.1175/JCLI-D-16-0498.1
Global Signatures and Dynamical Origins of the Little Ice Age and Medieval Climate Anomaly
Abstract
Global temperatures are known to have varied over the past 1500 years, but the spatial patterns have remained poorly defined. We used a global climate proxy network to reconstruct surface temperature patterns over this interval. The Medieval period is found to display warmth that matches or exceeds that of the past decade in some regions, but which falls well below recent levels globally. This period is marked by a tendency for La Niña–like conditions in the tropical Pacific. The coldest temperatures of the Little Ice Age are observed over the interval 1400 to 1700 C.E., with greatest cooling over the extratropical Northern Hemisphere continents. The patterns of temperature change imply dynamical responses of climate to natural radiative forcing changes involving El Niño and the North Atlantic Oscillation–Arctic Oscillation.
http://science.sciencemag.org/content/326/5957/1256
Frost fairs, sunspots and the Little Ice Age
Frost fairs, sunspots and the Little Ice Age | Astronomy & Geophysics | Oxford Academic
The Hockeystick confirms it all:
The Stick have been confirmed and improved by the 4 most comprehensive studies on the matter:
5 reasons why Manns "hockeystick" is here to stay. :
1. Its affirmed by US National Academy of Sciences (NAS)
https://www.nature.com/articles/4411032a.pdf?origin=ppub
They are one of the most respectable scientific academies and hold a very strong position world wide and in the US, all the way back since it was co-founded by Abraham Lincoln. As of 2016, the National Academy of Sciences includes about 2,350 members and 450 foreign associates. Approximately 200 members have won a Nobel Prize.
National Academy of Sciences - Wikipedia
Since then the hockey Stick is confirmed and improved by the 4 most comprehensive studies done on the matter:
2. 78 researchers from 24 countries, together with many other colleagues, worked for seven years in the PAGES 2k project on the new climate reconstruction. “2k” stands for the last 2000 years, while PAGES stands for the Past Global Changes program launched in 1991. Recently, their new study was published in Nature Geoscience.
It is based on 511 climate archives from around the world, from sediments, ice cores, tree rings, corals, stalagmites, pollen or historical documents and measurements. All data are freely available.
Most Comprehensive Paleoclimate Reconstruction Confirms Hockey Stick
Continental-scale temperature variability during the past two millennia
3. Planet Earth is warmer than it has been for at least 2,000 years, according to a study that took its temperature from 692 different “natural thermometers” on every continent and ocean on the planet.
The database gathers 692 records from 648 locations, including all continental regions and major ocean basins.
The records are from trees, ice, sediment, corals, speleothems, documentary evidence, and other archives. They range in length from 50 to 2000 years, with a median of 547 years, while temporal resolution ranges from biweekly to centennial.
The world is hotter than it has been for at least 2,000 years
A global multiproxy database for temperature reconstructions of the Common Era
4. Researchers reconstructed temperatures from fossil pollen collected from 642 lake or pond sites across North America -- including water bodies in Wyoming -- and Europe.[...]
The reconstructions indicate that evidence of periods that were significantly warmer than the last decade were limited to a few areas of the North Atlantic that were probably unusual globally. Shuman says results determined that the last decade was roughly 6.5 degrees Fahrenheit warmer today than it was 11,000 years ago. Additionally, the decade was at least one-half degree Fahrenheit warmer today than the warmest periods of that 11,000-year time frame, even counting for uncertainties, Shuman says.
Most of last 11,000 years cooler than past decade in North America, Europe
Reconciling divergent trends and millennial variations in Holocene temperatures
5. A Reconstruction of Regional and Global Temperature for the Past 11,300 Years
https://www2.bc.edu/jeremy-shakun/Marcott%20et%20al.,%202013,%20Science.pdf
BONUS:
The "hockeystick" data IS available here:
Michael E. Mann

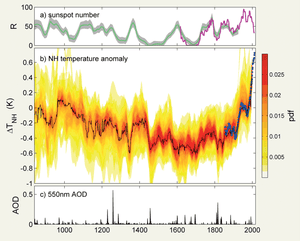
A team led by University of Reading physicist and solar expert Mike Lockwood wrote a paper reviewing the science behind frost fairs, sunspots, and the LIA. It included the figure below showing northern hemisphere temperatures along with sunspot number and the level of volcanic particles in the atmosphere over the past millennium:
Sunspot number, northern hemisphere temperatures, and volcanic aerosol optical depth (AOD) around the time of the Little Ice Age. Illustration: Lockwood et al. (2017), News & Reviews in Astronomy & Geophysics
During full blown ice ages, temperatures have generally been 4–8°C colder than in modern times. As this figure shows, during the LIA, temperatures were at most only about 0.5°C cooler than the early 20th century. Thus, Lockwood calls the Little Ice Age “a total misnomer.” As the authors put it:
"Compared to the changes in the proper ice ages, the so-called Little Ice Age (LIA) is a very short-lived and puny climate and social perturbation."
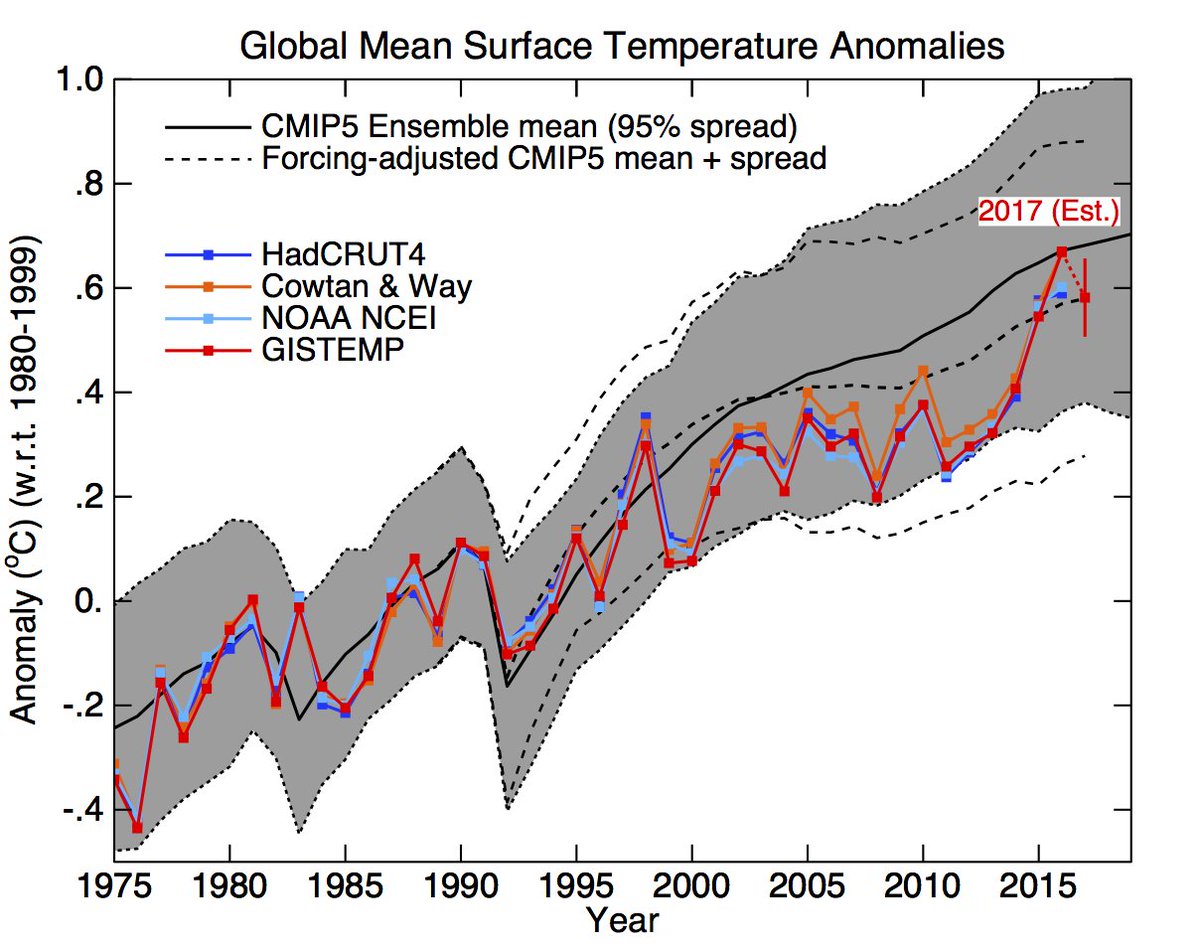
For comparison, temperatures have risen by a full 1°C over the past 120 years, and 0.7°C over just the past 40 years.
What ended the Little Ice Age?
Study on the Little Ice Age: Low solar activity just marginally cools the climate.
Abrupt onset of the Little Ice Age triggered by volcanism and sustained by sea‐ice/ocean feedbacks
https://agupubs.onlinelibrary.wiley.com/doi/full/10.1029/2011GL050168
The weakening sun was not the determinant factor for the Little Ice Age. Strong volcanic eruptions in particular, but also a smaller amount of greenhouse gases in the atmosphere were important factors during this period of cooler climate in the 16th and 17th century, a new study shows.
Impact of Volcanic Eruptions on Decadal to Centennial Fluctuations of Arctic Sea Ice Extent during the Last Millennium and on Initiation of the Little Ice Age
https://journals.ametsoc.org/doi/abs/10.1175/JCLI-D-16-0498.1
Global Signatures and Dynamical Origins of the Little Ice Age and Medieval Climate Anomaly
Abstract
Global temperatures are known to have varied over the past 1500 years, but the spatial patterns have remained poorly defined. We used a global climate proxy network to reconstruct surface temperature patterns over this interval. The Medieval period is found to display warmth that matches or exceeds that of the past decade in some regions, but which falls well below recent levels globally. This period is marked by a tendency for La Niña–like conditions in the tropical Pacific. The coldest temperatures of the Little Ice Age are observed over the interval 1400 to 1700 C.E., with greatest cooling over the extratropical Northern Hemisphere continents. The patterns of temperature change imply dynamical responses of climate to natural radiative forcing changes involving El Niño and the North Atlantic Oscillation–Arctic Oscillation.
http://science.sciencemag.org/content/326/5957/1256
Frost fairs, sunspots and the Little Ice Age
Frost fairs, sunspots and the Little Ice Age | Astronomy & Geophysics | Oxford Academic
Frost fairs have also been a key piece of “evidence” supporting the Little Ice Age. In 17th and 18th-century London, the Thames was said to have frozen over on multiple occasions, allowing people to celebrate on the icy river. This stopped in the 19th century, supposedly as the world came out of the Little Ice Age.
But the researchers found the ending of frost fairs had nothing to do with climate change. It was actually the result of an increased river flow, caused by the original London Bridge being demolished in 1825, and the Victoria embankment opening in 1870. Paintings from the era also continued to depict both warm and cool temperatures.
https://www.iflscience.com/environment/the-little-ice-age-was-very-very-little/The Hockeystick confirms it all:
The Stick have been confirmed and improved by the 4 most comprehensive studies on the matter:
5 reasons why Manns "hockeystick" is here to stay. :
1. Its affirmed by US National Academy of Sciences (NAS)
https://www.nature.com/articles/4411032a.pdf?origin=ppub
They are one of the most respectable scientific academies and hold a very strong position world wide and in the US, all the way back since it was co-founded by Abraham Lincoln. As of 2016, the National Academy of Sciences includes about 2,350 members and 450 foreign associates. Approximately 200 members have won a Nobel Prize.
National Academy of Sciences - Wikipedia
Since then the hockey Stick is confirmed and improved by the 4 most comprehensive studies done on the matter:
2. 78 researchers from 24 countries, together with many other colleagues, worked for seven years in the PAGES 2k project on the new climate reconstruction. “2k” stands for the last 2000 years, while PAGES stands for the Past Global Changes program launched in 1991. Recently, their new study was published in Nature Geoscience.
It is based on 511 climate archives from around the world, from sediments, ice cores, tree rings, corals, stalagmites, pollen or historical documents and measurements. All data are freely available.
Most Comprehensive Paleoclimate Reconstruction Confirms Hockey Stick
Continental-scale temperature variability during the past two millennia
3. Planet Earth is warmer than it has been for at least 2,000 years, according to a study that took its temperature from 692 different “natural thermometers” on every continent and ocean on the planet.
The database gathers 692 records from 648 locations, including all continental regions and major ocean basins.
The records are from trees, ice, sediment, corals, speleothems, documentary evidence, and other archives. They range in length from 50 to 2000 years, with a median of 547 years, while temporal resolution ranges from biweekly to centennial.
The world is hotter than it has been for at least 2,000 years
A global multiproxy database for temperature reconstructions of the Common Era
4. Researchers reconstructed temperatures from fossil pollen collected from 642 lake or pond sites across North America -- including water bodies in Wyoming -- and Europe.[...]
The reconstructions indicate that evidence of periods that were significantly warmer than the last decade were limited to a few areas of the North Atlantic that were probably unusual globally. Shuman says results determined that the last decade was roughly 6.5 degrees Fahrenheit warmer today than it was 11,000 years ago. Additionally, the decade was at least one-half degree Fahrenheit warmer today than the warmest periods of that 11,000-year time frame, even counting for uncertainties, Shuman says.
Most of last 11,000 years cooler than past decade in North America, Europe
Reconciling divergent trends and millennial variations in Holocene temperatures
5. A Reconstruction of Regional and Global Temperature for the Past 11,300 Years
https://www2.bc.edu/jeremy-shakun/Marcott%20et%20al.,%202013,%20Science.pdf
BONUS:
The "hockeystick" data IS available here:
Michael E. Mann
Global comparisons of proxy records suggest that there was no globally coherent “Little Ice Age”. This is well illustrated by the PAst Global changEs (PAGES) 2k networks huge proxy assimilation study published in 2013 in Nature Geoscience Continental-scale temperature variability during the past two millennia
“There were no globally synchronous multi-decadal warm or cold intervals that define a worldwide Medieval Warm Period or Little Ice Age, but all reconstructions show generally cold conditions between AD 1580 and 1880, punctuated in some regions by warm decades during the eighteenth century”