
La oss strippe vekk all politikk, ideologi, agenda og religion og la oss rett og slett bare se på hva skolevitenskapen forteller oss. Den er enkel å forstå og handler ikke om modeller, spådommer, gjetting eller estimeringer, men om enkle, direkte observasjoner. Ingenting her er omstridt, eller har alternative forklaringer. Dette er vitenskap som, hvem som helst, når som helst, kan reprodusere gjennom enkle eksperimenter og undersøkelser. Dette er kunnskap som strekker seg 200 år tilbake i tid. Jeg linker til fagfellevurdert litteratur/leksikon hele veien. Sjekk og referanselisten aller sist.
På 1800-tallet kom det tre oppdagelser som er sentrale i i klimaforskningen:
Oppdagelsen av drivhuseffekten
Discovery of the greenhouse effect.
På 1820-tallet beregnte Joseph Fourier at et objekt av jordens størrelse, og med sin avstand fra Solen, burde være betydelig kaldere enn planeten faktisk er, hvis den kun varmes opp av innkommende solstråling. (9a)
In the 1820s Joseph Fourier calculated that an object the size of the Earth, and at its distance from the Sun, should be considerably colder than the planet actually is if warmed by only the effects of incoming solar radiation.(9a)
He examined various possible sources of the additional observed heat in articles published in 1824 and 1827. While he ultimately suggested that interstellar radiation might be responsible for a large portion of the additional warmth, Fourier's consideration of the possibility that the Earth's atmosphere might act as an insulator of some kind is widely recognized as the first proposal of what is now known as the greenhouse effect, although Fourier never called it that.
------------------------------
John Tyndall discovers that some gases block infrared radiation. He suggests that changes in the concentration of the gases could bring climate change.
In January 1859, Tyndall began studying the radiative properties of various gases. Part of his experimentation included the construction of the first ratio spectrophotometer, which he used to measure the absorptive powers of gases such as water vapor, "carbonic acid" (now known as carbon dioxide), ozone, and hydrocarbons. Among his most important discoveries were the vast differences in the abilities of "perfectly colorless and invisible gases and vapors" to absorb and transmit radiant heat. He noted that oxygen, nitrogen, and hydrogen are almost transparent to radiant heat while other gases are quite opaque.

Tyndall's experiments also showed that molecules of water vapor, carbon dioxide, and ozone are the best absorbers of heat radiation, and that even in small quantities, these gases absorb much more strongly than the atmosphere itself.
CO2 happens to have a special feature naturally. It absorbs heat radiation very effectively. It has to do with the vibratory and rotational properties of the molecule itself. The structure of their molecules makes them especially effective at absorbing heat radiation while the major atmospheric gases, nitrogen and oxygen, are essentially transparent to it.
We can easily measure their properties in laboratories, and derive them from quantum physics.Thats just how it is. Nature made that happen. Thats what basic physics tells us.
Co2 har altså en spesiell egenskap naturlig. Den absorberer varmestråling veldig effektivt. Det har å gjøre med selve vibrasjons- og rotasjonsegenskapene til molekylet. Vi kan lett måle deres egenskaper i laboratorier, og utlede dem fra kvantefysikken. Konsentrasjonen korrelerer med temperaturen gjennom istidene, og vi ser at planeter med CO2 i atmosfæren har en varmere overflate enn en ren varmebalanse skulle tilsi. Venus er et ekstrem-eksempel.

The above graphs show the percentage of radiation that gases found in the Earth's atmosphere absorb. Methane (CH4,) carbon dioxide (CO2,) and water vapor (H2O,) absorb strongly in the thermal infrared (4–100 µm.)
Og i 1896 oppdaget svensken og nobelprisvinneren Svante Arrhenius at vi kan
"calculate estimates of the extent to which increases in atmospheric carbon dioxide increase Earth's surface temperature through the Arrhenius effect, leading David Keeling to conclude that human-caused carbon dioxide emissions are large enough to cause global warming"
I en journal som ble publisert i 1896, gjorde Arrhenius en tidlig beregning av hvor mye varmere Jorden var, takket være energifanger-egenskapen til noen av gassene i atmosfæren. Selv i dette tidlige stadiet forsto han at mennesker hadde potensial til å spille en viktig rolle ved å endre konsentrasjonen av minst en av disse gassene, C02.
Using 'Stefan's law' (better known as the Stefan-Boltzmann law), he formulated what he referred to as a 'rule'. In its original form, Arrhenius' rule reads as follows:
-
- if the quantity of carbonic acid [ CO2 + H2O → H2CO3 (carbonic acid) ] increases in geometric progression, the augmentation of the temperature will increase nearly in arithmetic progression.
The following formulation of Arrhenius' rule is still in use today.
Arrhenius fysiske lov er fremdeles i bruk i dag!
Arrhenius fysiske lov er fremdeles i bruk i dag!

Her er en vitenskapelig tidslinje om Global Oppvarming.
Just how long have we known about climate change anyways?
Allerede i 1912 ble det advart om farene med CO2 utslipp:
THE GREENHOUSE EFFECT
While other planets in Earth's solar system are either scorching hot or bitterly cold, Earth's surface has relatively mild, stable temperatures. Earth enjoys these temperatures because of its atmosphere, which is the thin layer of gases that cloak and protect the planet.
Step 1: Solar radiation reaches the Earth's atmosphere - some of this is reflected back into space.
Step 2: The rest of the sun's energy is absorbed by the land and the oceans, heating the Earth.
Step 3: Heat radiates from Earth towards space.
Step 4: Some of this heat is trapped by greenhouse gases in the
atmosphere, keeping the Earth warm enough to sustain life.
Step 5: Human activities such as burning fossil fuels, agriculture and land clearing are increasing the amount of greenhouse gases released into the atmosphere.
Step 6: This is trapping extra heat, and causing the Earth's temperature to rise.

The Atmosphere, the Ocean and Environmental Change (GG 140) A simple model of the overall Earth's heat budget is derived. The Earth is assumed to be in equilibrium with the input of solar radiation balanced by the output of infrared radiation emitted by the Earth's surface. Using this model, the Earth's surface temperature is calculated to be cooler than in reality due to the lack of an atmosphere and the greenhouse effect in the model. 00:00 - Chapter 1. Earth Energy Balance 03:34 - Chapter 2. Black Body Radiation -- Wien's Law and Stephan-Boltzmann Law 16:05 - Chapter 3. Infrared Emission 18:08 - Chapter 4. Simple Model of Earth's Energy Balance 25:51 - Chapter 5. Equilibrium Calculations of Earth's Energy Budget 33:29 - Chapter 6. Greenhouse Effect in Earth's Atmosphere 40:39 - Chapter 7. Energy Budgets for Other Planets 45:24 - Chapter 8. What is a Greenhouse Gas? Complete course materials are available at the Open Yale Courses website: http://oyc.yale.edu
Here's what they're teaching undergrads at Stanford:
Vanndamp er en viktig drivhusgass, men er bare i atmosfæren en kort stund (timer til dager) før den kondenserer og blir til skyer, og etterhvert regner ut. Den er en del av vannets kretsløp. Hadde den hatt lengre "levetid" i atmosfæren og konsentrasjonene økt på samme måte som CO2, hadde det vært drepen. Men konsentrasjonene har heldigvis vært mer stabile. Det som skjer med en global oppvarming er at luften kan inneholde mer vanndamp og fordampningen øker. Økt temperatur gir økt fordampning og mer vanndamp i atmosfæren, som igjen gir økt temperatur. En slik sammenheng kalles en tilbakekopling (feedback-effect).
Hvor mye C02 utgjør av atmosfæren er en sammenligning som ikke betyr noe. Det er bare drivhusgassene som kan fange opp varmestråling. Det resten av atmosfæren bidrar med, er bare å overta varme fra CO2, vanndamp og co. når de først har fanget den opp (12). Den globale oppvarmingen øker fordampningen og øker takten på vannets kretsløp.
Klimaforskeren Keah Schuenemann forklarer:
Mer info om vanndamp/C02.
Water vapor doesn't accumulate, it rains out. What's accumulating, is CO2 and Methane. Water vapor *amplifies* the CO2 effect. But it doesn't accumulate like CO2 and Methane do. so it's not itself a driver of the changes we see. The amount of water vapor in the air is a function of temperature and pressure. As temperatures go up, the air will hold slightly more vapor, and that in turn traps more heat. The amount of vapor can be calculated using the Clausius-Clapeyron equations that are taught in 1st year physics
https://en.wikipedia.org/wiki/Clausius%E2%80%93Clapeyron_relation
CO2 er "minst" effektiv som drivhusgass per kg, men likevel er gassens bidrag til den globale oppvarmingen størst (11), fordi mengden som slippes ut er mange ganger større enn mengden av de andre drivhusgassene. CO2 står for ca 60 % av den menneskeskapte forsterkningen av drivhuseffekten frem til i dag.
De ikke-kondenserende klimagassene CO2, ozon, N2O (lystgass), CH4 (metan) og klorfluorkarboner, står for 25% av den totale jordbaserte drivhuseffekten, og tjener således til å gi den stabile temperaturstrukturen som opprettholder dagens nivåer av atmosfærisk vanndamp og skyer via feedbacks-prosesser som står for de resterende 75% av drivhuseffekten.
Thomas Stocker starts by debunking three of the most popular climate change myths. He is one of the leading researchers in the field of climate and regularly advises the UN. At the end of the talk, he shows the way out of climate change: decarbonisation. Thomas Stocker graduated from ETH Zürich in 1987 and held research positions in London, Montreal and New York. Since 1993 he is Professor of Climate and Environmental Physics at the University of Bern. This research group is leading in the reconstruction of greenhouse gas concentrations from polar ice cores and the simulation of past and future climate changes. From 2008 to 2015 he co-chaired Working Group I of the IPCC, the United Nations Intergovernmental Panel on Climate Change. This talk was given at a TEDx event using the TED conference format but independently organized by a local community. Learn more at http://ted.com/tedx
If there had been no increase in the amounts of non-condensable greenhouse gases, the amount of water vapor in the atmosphere would not have changed with all other variables remaining the same. The addition of the non-condensable gases causes the temperature to increase and this leads to an increase in water vapor that further increases the temperature. This is an example of a positive feedback effect. The warming due to increasing non-condensable gases causes more water vapor to enter the atmosphere, which adds to the effect of the non-condensables.
Her ser vi 11-åringen Emily Short gjenskape drivhuseffekten med et enkelt eksperiment hjemme i stuen. Det ER C02 som utmerker seg:
Without CO2 and the other non-condensing greenhouse gases ability to absorb infrared radiation, the terrestrial greenhouse would collapse and throw the global climate into an ice-bound state. Without the greenhouse gases in the atmosphere, the mean temperature of the Earth would be down to -15 degrees Celsius instead of + 15 degrees Celsius.
Hvor "liten" og "ubetydelig" de ikke-kondenserende klimagassene, deriblant C02 er, beskrives vel best slik:
Uten CO2 og de andre ikke-kondenserende drivhusgassenes egenskap til å absorbere infrarød stråling, ville det jordbaserte drivhuset kollapse og kaste det globale klimaet inn i en isbundet tilstand. Uten drivhusgassene i atmosfæren ville middeltemperaturen på Jorden vært ned mot -18 grader celsius istedenfor + 15 grader celsius.
En forsterket drivhuseffekt er ikke det eneste som påvirker klimaet. Sola er alltid en faktor, havstrømmer endrer seg, og mengden skyer varierer fra år til år. Men solen kan ikke forklare den kraftige oppvarmingen vi har sett de siste 40 år da varmen fra solen har vært nedadgående i denne perioden. Nedre del av atmosfæren blir varmere mens den ytre blir kaldere. Et tydelig menneskelig avtrykk.
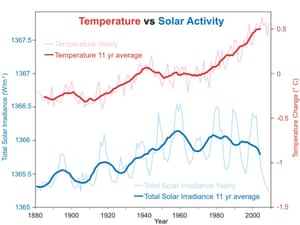
Annual global temperature change (thin light red) with 11 year moving average of temperature (thick dark red). Temperature from NASA GISS. Annual Total Solar Irradiance (thin light blue) with 11 year moving average of TSI (thick dark blue). TSI from 1880 to 1978 from Krivova et al 2007 (data). TSI from 1979 to 2009 from PMOD.
Hvis denne påstanden er sann, bør vi se at mengden av IR (Infrarød stråling) som forlater planeten, har gått ned over tid, og den nedgangen bør samsvare med økningen i CO2. Det er selvfølgelig akkurat hva satellittdataene viser (Harries et al. 2004; Griggs and Harries 2007). IRen som har forlatt jorden siden 70-årene har gått ned, og den nedgangen samsvarer med økningen i CO2. Dette er en direkte observasjon av menneskeskapte klimaendringer og kan ikke forklares med noe annet enn at vår CO2 fanger varme.
GHGs, CO2, slow the transmission of IR energy from the surface into space by absorbing and re-emitting IR photons instead of being transparent to IR like non-GHG molecules
If that claim is true, then we should see that the amount of IR leaving the planet has decreased over time, and that decrease should match the increase in CO2. That is, of course, exactly what satellite data show (Harries et al. 2001; Griggs and Harries 2007). The IR leaving the earth since the 70s has decreased, and that decrease matches the increase in CO2. This is a direct test of anthropogenic climate change and cannot be explained by anything other than our CO2 trapping heat. (9)
https://research-information.bristol.ac.uk/files/3006745/paper.pdf
https://journals.ametsoc.org/doi/full/10.1175/JCLI4204.1
The earth’s climate is constrained by well-known and elementary physical principles, such as energy balance, flow, and conservation. Greenhouse gases affect the atmospheric optical depth for infrared radiation, and increased opacity implies higher altitude from which earth’s equivalent bulk heat loss takes place. Such an increase is seen in the reanalyses, and the outgoing long-wave radiation has become more diffuse over time, consistent with an increased influence of greenhouse gases on the vertical energy flow from the surface to the top of the atmosphere.
https://link.springer.com/article/10.1007%2Fs00704-016-1732-y
We have shown that longwave downward radiation flux increases at Earth's surface can be accurately measured, subdivided and explicitly explained and backed with model calculations as cloud-, temperature-, water vapour- and enhanced greenhouse gas radiative forcing effect. Radiative forcing - measured at Earth's surface - corroborate the increasing greenhouse effect.
http://onlinelibrary.wiley.com/doi/10.1029/2003GL018765/full
The changes of the outgoing longwave radiation (OLR) in clear-sky conditions have been calculated using High Resolution Infrared Radiation Sounder (HIRS) observations from 1979 to 2004.[...] The observed increase in GHE is shown to be inconsistent with the control ensemble, indicating that anthropogenic forcings are required to reproduce the observed changes in GHE. Satellite-Based Reconstruction of the Tropical Oceanic Clear-Sky Outgoing Longwave Radiation and Comparison with Climate Models.
http://journals.ametsoc.org/doi/abs/10.1175/JCLI-D-13-00047.1
Increased greenhouse gasses reduce the transmission of Outgoing Longwave Radiation (OLR) to space along spectral absorption lines eventually causing the Earth’s temperature to rise in order to preserve energy equilibrium. This greenhouse forcing effect can be directly observed in the Outgoing Longwave Spectra (OLS) from space-borne infrared instruments with sufficiently high resolving power. A decade of measured greenhouse forcings from AIRS.
http://proceedings.spiedigitallibrary.or/proceeding.aspx?articleid=1690262
Then we know that the warming is due to the increase in greenhouse effect measured from direct satellite measurements of reduced Outgoing Longwave Radiation (OLR) (John E. Harries et al 2001)in the specific wavelengths absorbed by CO2 (and others).
http://www.nature.com/nature/journal/v410/n6826/abs/410355a0.html
Global atmospheric downward longwave radiation over land surface under all-sky conditions from 1973 to 2008.
http://onlinelibrary.wiley.com/doi/10.1029/2009JD011800/pdf
ROSINEN I PØLSEN - DET UDISKUTABLE BEVISET
First Direct Observation of Carbon Dioxide’s Increasing Greenhouse Effect at the Earth’s Surface
Berkeley Lab researchers link rising CO2 levels from fossil fuels to an upward trend in radiative forcing at two locations
Wow.
BEVISET FOR
"the critical link between c02 concentrations and the addition of energy to the system, or the greenhouse effect [...] and further confirmation that the calculations used in today’s climate models are on track when it comes to representing the impact of CO2.
Scientists have observed an increase in carbon dioxide’s greenhouse effect at the Earth’s surface for the first time. The researchers, led by scientists from the US Department of Energy’s Lawrence Berkeley National Laboratory (Berkeley Lab), measured atmospheric carbon dioxide’s increasing capacity to absorb thermal radiation emitted from the Earth’s surface over an eleven-year period at two locations in North America. They attributed this upward trend to rising CO2 levels from fossil fuel emissions.
The influence of atmospheric CO2 on the balance between incoming energy from the Sun and outgoing heat from the Earth (also called the planet’s energy balance) is well established. But this effect has not been experimentally confirmed outside the laboratory until now.

The results agree with theoretical predictions of the greenhouse effect due to human activity. The research also provides further confirmation that the calculations used in today’s climate models are on track when it comes to representing the impact of CO2.
They found that CO2 was responsible for a significant uptick in radiative forcing at both locations, about two-tenths of a Watt per square meter per decade. They linked this trend to the 22 parts-per-million increase in atmospheric CO2 between 2000 and 2010. Much of this CO2 is from the burning of fossil fuels, according to a modeling system that tracks CO2 sources around the world.
“We see, for the first time in the field, the amplification of the greenhouse effect because there’s more CO2 in the atmosphere to absorb what the Earth emits in response to incoming solar radiation,” says Daniel Feldman, a scientist in Berkeley Lab’s Earth Sciences Division and lead author of the Nature paper.
“Numerous studies show rising atmospheric CO2 concentrations, but our study provides the critical link between those concentrations and the addition of energy to the system, or the greenhouse effect,” Feldman adds.
Taking the pulse of greenhouse gases
..this instrument can spot microscopic molecules of CO2 and H2O in a narrow column of air in less than the blink of an eye. CO2 and H2O both trap heat in Earth's atmosphere.
HVORDAN VET VI AT DET ER VÅRT C02 SOM VARMER OPP KLODEN?
HOW DO WE KNOW ITS HUMAN CO2 WARMING THE EARTH?
Karbonet i det CO2et som er i atmosfæren (13) inneholder informasjon om hvor det kommer fra, slik at forskere kan regne ut at fossilt brensel-utslipp er den største kilden til varmeøkningen siden preindustriell tid. Vi kan sjekke mengden radioaktive karbonatomer i atmosfæren. Denne endrer seg, akkurat som vi forventer hvis det er fossilt karbon - som har en annen mengde radioaktivitet - som har kommet opp i atmosfæren. Det karbonet som kommer fra fossilt brent C02 har altså isotop-signaler som ingen av de andre naturlige kildene til C02 har! Det er som et fingeravtrykk. Det er karbonets "DNA". Det er unikt.
14-Karbon-metoden.
Dette er en måte å datere organiske levninger på (ting som inneholder karbon) gjennom å se på hvilke proporsjoner som de forskjellige isotopene for karbon finnes i et gitt materiale.
Det finnes tre vanlige isotoper for karbon på jorda - C12 (ca. 99%), C13 (1%), og C14 (mye mindre enn 1%). Over tid (men med en fast takt) blir C14 omdannet til andre grunnstoffer. Planter og andre ting som puster, tar opp i seg C14 gjennom å ta inn karbon fra atmosfæren. Når planten - eller andre organismer - dør, slutter den å ta inn karbon fra atmosfæren. Mengden - og proporsjonen - for karbon er dermed den samme som var i atmosfæren da. Dette er relativt kjent tilbake til ca. 45 000 år før vår tidsregning. Over tid går C14 over til andre ting, siden det er en radioaktiv isotop - og dermed endrer proporsjonen av C14 seg i forhold til mengden av C12 og C13 (som begge er relativt konstante). Dermed kan en måle proporsjonen av C14 som er igjen i det en har funnet, og deretter sammenlikne det med disse tabellene for en relativt nøyaktig datering (eller estimert, for en mer unøyaktig datering), tilbake til ca. 60 000 år. Dersom en har noe som er eldre enn det, må en bruke andre dateringsmetoder.
The Suess Effect is a term which has come to signify the decrease in 14C in atmospheric CO2 owing to admixture of CO2 produced by the combustion of fossil fuels. This term is here extended, as a concept, to the shifts in isotopic ratio of both 13C and 14C in any reservoir of the carbon cycle owing to anthropogenic activities.

De samme elementene (dvs. samme antall protoner i kjernen) med forskjellige massetall (som kommer fra forskjellige antall nøytroner i kjernen) kalles isotoper. Hvert karbonmolekyl har seks protoner i kjernen, men det er mange forskjellige isotoper med varierende antall nøytroner i kjernen. Karbonisotoper fra forskjellige kilder er "lettere" (høy negativ verdi) eller tyngre (lavere negativ verdi). For eksempel er karbon fra havet standarden, med en verdi på "0", mens karbon fra fossile brensler varierer fra -20 til -32.(3) Mens atmosfærisk karbon har en gjennomsnittsverdi på -5 til -9, blir den "lettere" over tid da karbon fra fossile brensel blir mer rikelig i atmosfæren. (Bohm et al. 2002; Ghosh and Brand 2003;Wei et al. 2009).
Planter foretrekker den lette karbonisotopen 12C i fotosyntesen, og har derfor et lavere 13C/12C forhold (ð13C) enn atmosfærisk CO2. Ettersom fossilt brensel er bygget opp fra organisk plantemateriale, vil utslipp av CO2 fra bruk av fossile brensler føre til synkende verdier av ð13C i atmosfæren (figur 3).
“Figur 3. Månedlige målinger av ð13C fra Mauna Loa, Hawaii (blå farge) og Baring Head, New Zealand (rød farge). Som for atmosfærens CO2 økning i figur 1 viser også målinger fra ulike stasjoner rundt om på kloden samme trend i ð13C (Keeling m. fl. 2005). “

Changes in the 13C/12C ratio of atmospheric CO2 are also caused by other sources and sinks, but the changing isotopic signal due to CO2 from fossil fuel combustion can be resolved from the other components (Francey et al., 1995).
Additional confirmation that rising CO2 levels are due to human activity comes from examining the ratio of carbon isotopes found in the atmosphere. Carbon 12 has 6 neutrons, carbon 13 has 7 neutrons. Plants have a lower C13/C12 ratio than in the atmosphere. If rising atmospheric CO2 comes from fossil fuels, the C13/C12 should be falling. Indeed this is what is occurring (Ghosh 2003). The C13/C12 ratio correlates with the trend in global emissions.
Det er altså menneskelige fingeravtrykk på overbelastningen av karbon. Når mennesker brenner kull, olje og gass (fossilt brensel) for å generere elektrisitet eller kjøre bil, slippes karbondioksid ut i atmosfæren, hvor den fanger opp varme. Et karbonmolekyl som kommer fra fossile brensler og avskogning er "lettere" enn det kombinerte signalet fra andre kilder. Ettersom forskere måler «vekten» av karbon i atmosfæren over tid ser de en klar økning i de lettere molekylene fra fossilt brensel og avskogingskilder som korresponderer nøyaktig med den kjente utviklingen i utslipp.
Humans did not appear until about 200,000 years ago - and atmospheric CO2 has not exceed that concentration until the industrial revolution brought with it massive emissions from the combustion of fossil fuels: coal and oil.
Den 9. mai 2013 overgikk den daglige gjennomsnittlige konsentrasjonen av karbondioksid i atmosfæren målt ved Mauna Loa 400 ppm for første gang siden målingene begynte i 1958. Estimater for karbondioksid under tidligere geologiske perioder antyder at CO2-nivået ikke har ligget på dette nivået siden midten av Pliocen for to til fire millioner år siden.

On the causal structure between CO2 and global temperature
Abstract
We use a newly developed technique that is based on the information flow concept to investigate the causal structure between the global radiative forcing and the annual global mean surface temperature anomalies (GMTA) since 1850. Our study unambiguously shows one-way causality between the total Greenhouse Gases and GMTA. Specifically, it is confirmed that the former, especially CO2, are the main causal drivers of the recent warming. A significant but smaller information flow comes from aerosol direct and indirect forcing, and on short time periods, volcanic forcings. In contrast the causality contribution from natural forcings (solar irradiance and volcanic forcing) to the long term trend is not significant. The spatial explicit analysis reveals that the anthropogenic forcing fingerprint is significantly regionally varying in both hemispheres. On paleoclimate time scales, however, the cause-effect direction is reversed: temperature changes cause subsequent CO2/CH4 changes.
Studies: atmospheric CO2 drives climate change ancient and modern.
Studies: atmospheric CO2 drives climate change ancient and modern.

Videre tekst er hentet fra nettstedet Skeptoid. Skeptoid er Brian Manning.
Skeptoid: Critical Analysis of Pop Phenomena is an award-winning weekly science podcast. Since 2006, Skeptoid has been revealing the true science behind popular misinformation and urban legends.
Siden hans har vunnet en rekke vitenskapelige priser for sitt arbeide:

Tekst Brian Manning. Oversettelse: Roger Fjellstad Olsen
Du tenker kanskje at karbon er karbon, og at hvis vi finner økning av CO2 i atmosfæren, er ikke kilden lett å påvise. Men kjemi er litt mer komplisert enn som så; det er forskjellige typer karbon, som det er for de fleste elementer. De er kalt isotoper. En isotop av karbon er karbon-14. Kosmiske stråler bombarderer jorden med en hastighet som er mer eller mindre konstant over tid. Når de gjør det, treffer de atomer i den øvre atmosfæren, sparker ut nøytroner. Disse nøytronene kolliderer deretter med de vanligste atomene i atmosfæren, nitrogen. Denne kollisjonen sparker en proton ut av kjernen og gjør om nitrogenet til karbon med to nøytroner for mange: det ustabile og radioaktive karbon-14, i stedet for den normale stabile karbon-12.
Karbon 14-datering utføres ved å sammenligne de relative mengder av karbon-12 og karbon-14 i en prøve. Levende ting, som dyr og trær, er i likevekt med atmosfæren. Når de spiser og puster og samhandler, inneholder de samme proporsjoner av karbonisotoper som atmosfæren. Når de dør, vil karbon-14 avta over en lengre periode, og da organismen ikke lenger spiser og puster, vil ikke ny karbon-14 komme inn i atmosfæren, og til slutt vil karbon-12 (og noe karbon-13) være de eneste.
(1) Fossile brensler som olje og naturgass kommer fra planter som døde for millioner av år siden, og har ingen karbon-14 igjen. Den CO2 som produseres ved forbrenning av fossile brensler inneholder kun karbon-12.
Når en skogbrann herjer, vil CO2 i røyken komme fra levende eller nylig døde brensler, slik at røyken inneholder de samme mengder karbon-12 og karbon-14 som atmosfæren. Dette er tilfellet med nesten alle naturlige kilder til CO2. (2)Vi kan karbondatere CO2 i atmosfæren, og fortelle nøyaktig hvor mye av det som kommer fra menneskers forbruk av fossile brensler(3)(4). Det er en sikker måling. Det etterlates ikke rom for tolkning.
Det er èn naturlig kilde av CO2 som bare inneholder karbon-12, og som ofte påpekes av klimaskeptikere som den virkelige kilden til denne nye karbon-12: vulkaner. Vulkaner over hele verden har stadige utbrudd både på land og under havet. De gjør det i et ganske konstant tempo. Vi måler deres CO2- produksjon, og vi vet at årlig på verdensbasis bidrar vulkansk aktivitet gjennomsnittlig om lag 200 millioner tonn CO2 til atmosfæren, alle med karbon-12, som ikke kan "skilles" fra karbon-12 produsert ved forbrenning av fossilt brensel.(3)(4) Men hvert år, måles det totalt ca 29* milliarder tonn CO2 til atmosfæren. Det er mer enn 100 ganger (5)(6) (7) den mengden vulkaner står for. Den eneste mulige kilden til dette nye CO2et, er fossilt brensel brent av mennesker.
Dette, er kort sagt, det avslørende beviset for at økningen i CO2 i atmosfæren er forårsaket av menneskers forbruk av fossilt brensel. (8) Det er ikke en formodning eller en modell eller et anslag, det er en måling alle kan reprodusere, og isotoper er isotoper, og har ikke alternative forklaringer(3) (4).
Some have said that 29 (its 40 billion tons now) is not a problem, because of how small that is compared to the atmosphere's total existing carbon load. It's true that 40 billion tons is a drop in the bucket compared to the 750 billion tons that moves through the carbon cycle each year, which is our name for the natural processes by which carbon is exchanged between the atmosphere and the oceans and vegetation.
All of this extra carbon needs to go somewhere. So far, land plants and the ocean have taken up about 55 percent of the extra carbon people have put into the atmosphere while about 45 percent has stayed in the atmosphere.
Eventually, the land and oceans will take up most of the extra carbon dioxide, but as much as 20 percent may remain in the atmosphere for many thousands of years.
The Carbon Cycle

Bevis på at det menneskeskapte CO2et varmer planeten:
Vi har heller ikke behov for modeller eller forutsigelser for direkte å måle varmekilden i atmosfæren. Det er fem gasser som er hovedansvarlig for drivhuseffekten.(8) De er CO2, metan, vanndamp, dinitrogenoksid og ozon. Vi kan si dette på grunn av spektroskopi. Spektroskopi er en fremgangsmåte for å påvise elementer ved å se på hvordan elektromagnetisk stråling passerer gjennom dem. Ulike elementer har elektroner i baner med varierende energinivå, og dette påvirker måten de responderer. Det er grunnen til at neonlys produserer forskjellige farger avhengig av hvilke gasser vi fyller dem med. Det er også på den måten vi er i stand til å finne ut hva andeler av hydrogen, helium og andre elementer som er i fjerne stjerner: spekteret av lyset som kommer fra dem har topper og daler som er kjemiske fingeravtrykk av nøyaktig hva gasser som er i dem.
Jordens overflate er oppvarmet av solen, og som en varm verden i verdensrommet(9), avgir jorden selv den samme varmen tilbake ut igjen, som infrarød stråling. Hvis vi går utenfor og peker et spektrometer på himmelen, kan vi se det er topper og daler i det infrarøde spekteret. Noen bølgelengder av varme flyr rett ut i verdensrommet uhindret, mens andre bølgelengder absorberes av atmosfæren, og den varmen holder seg der, hvor vi er i stand til å oppdage dens bølgelengde med vår spektrometer. Og akkurat på samme måte som vi er i stand til å identifisere elementene i en fjern stjerne, er vi i stand til å identifisere nøyaktig hvilke klimagasser som fanges i jordas strålingsvarme. Det er slik vi var i stand til å identifisere de fem hovedgassene. Og dette er ikke noe nytt; vi har forstått dette i 200 år. Det er en direkte måling som alle med et spektrometer kan reprodusere. Ikke en modell, ikke en prognose, ikke en gjetning.
Vanndamp, som er det mest fremtredende, definerer den grunnleggende formen av drivhusspekteret. Mesteparten av den infrarøde strålingen som unnslipper Jorden går gjennom et vindu som står åpent pga vanndamp, som vi kaller det infrarøde vinduet. Dette vinduet i spekteret, som er ganske bredt, er sentrert omkring en bølgelengde på omtrent 10 um (mikrometer). Ved høyere og lavere bølgelengder, vil vanndamp absorbere mye av jordens utstrålte varme, så Jorden har alltid stolt på dette åpne vinduet i spekteret slik at overflødig varme kan unnslippe. En ende av det infrarøde vinduet er overlappet av CO2s-absorpsjon-rekkevidde, som er sentrert rundt 15 um. Mengden CO2 i atmosfæren fungerer som en skyvedør som utvider eller begrenser det infrarøde vinduet. Når CO2 nivået øker, er det infrarøde vinduet smalere, mindre stråling slipper ut i verdensrommet, og mer varme blir absorbert av atmosfæren. I den andre enden av det infrarøde vinduet, rundt 7,5 um, har metan en lignende virkning, og bidrar med oppvarming som utgjør ca 1/4 av det som CO2 gjør.

Spektroskopi (10) er vanntett vitenskap. Vi trenger ikke å modellere eller forutsi. Bare ved å peke våre instrumenter på himmelen, kan vi , akkurat nå, direkte observere og identifisere klimagasser, og måle nøyaktig hvor mye strålingsenergi atmosfæren absorberer og hvor mye som holder seg her på jorden. Denne direkte, ikke-tvetydig spektroskopiske avlesing er det avslørende beviset for at energien fra overskuddsvarme som blir fanget i atmosfæren skyldes CO2.
Vi har også målt jordas infrarøde spekter fra verdensrommet, fra satellitter, for å se hvilke bølgelengder av varmeenergi som blir fanget av gasser i atmosfæren, og hvilke som unnslipper. Vi startet med dette i 1970 med IRIS satellitten, noe som gir oss en basis til å sammenligne mot fremtidige målinger. Dette ble fulgt opp i 1996 med den japanske IMG satellitten, og igjen med AIRS satellitten i 2003, og AURA satellitten i 2004. De tegnet et veldig klart bilde.

For å se deltaet isolerer vi de nye målingene fra de gamle, for å se nøyaktig hvor i spekteret noen endring har skjedd.
Energy being trapped in the atmosphere corresponds exactly to the wavelengths of energy captured by CO2.
Innenfor det infrarøde vinduet som er definert av vanndamp, er det et stort utslag; 15 um spekteret for CO2.(9) Dette er eksplisitt og entydig bevis på at den økte varmen i atmosfæren skyldes CO2. Det har ingenting å gjøre med modeller eller spådommer; det er en direkte observasjon, det er kjemi og grunnleggende fysikk, ikke gjetting eller estimering.
BONUS:
Lover og litt kvantefysikk
To effekter av Henrys lov er viktige i dagens klimadebatt: (1) Når atmosfærens innhold av CO2 øker vil havets opptak av CO2 øke, og (2) en oppvarming av havet vil føre til utgassing av CO2 fordi løseligheten avtar når det blir varmere. Disse effektene vil motvirke hverandre i dagens verden
Henrys lov (1) (se Henryloven) sier at løseligheten av en gass i en væske er proporsjonal med partialtrykket til gassen. Økt mengde CO2 i atmosfæren fører dermed til økt opptak i havet. Løseligheten avtar imidlertid med økende temperatur, så hvis havet blir varmere, vil det derfor gå CO2 fra havet og til lufta. Målinger viser at det er den første prosessen som dominerer nå, og at havets innhold av CO2 øker, noe som bidrar til havforsuring.
Why Henrys Law is not in conflict with Greenhouse Theory:
Two effects of Henry's law are important in today's climate debate: (1) As the atmospheric CO2 content increases, the ocean's absorption of CO2 will increase, and (2) a warming of the ocean will lead to the release of CO2 because its solubility decreases when it gets warmer. These effects will counteract each other in today's world
Henry's law (1) states that the solubility of a gas in a liquid is proportional to the partial pressure of the gas. Increased amount of CO2 in the atmosphere thus leads to increased absorption in the ocean. However, solubility decreases with increasing temperature, so if the sea gets warmer, CO2 will flow from the sea to the air. Measurements show that it is the first process that dominates now and that the ocean's CO2 content increases, which contributes to marine acidification.
https://www.britannica.com/science/Henrys-law?fbclid=IwAR39AIdbrDZ6HFQ16mEDw1M8IHKCeqrnEtZiZeFiTtnIA2rYdNR06IQxTGE
Termodynamikkens andre lov er vel best beskrevet slik:
"Varme kan generelt ikke strømme spontant fra et materiale ved lavere temperatur til et materiale ved høyere temperatur."
Så hvis du setter noe varmt ved siden av noe kaldt, blir det ikke varmere, og det kalde blir ikke kaldere. Det er så tydelig at det ikke nødvendigvis trenger en forsker å si det, vi vet dette fra våre daglige liv. Hvis du setter en isterning i drikken din, koker den ikke!
Noen vil hevde at fordi luften, inkludert drivhusgassene, er kjøligere enn jordens overflate, kan den ikke varme jorden. Hvis den gjorde det, betyr det at varme må flyte fra kald til varmt, tilsynelatende et brudd på termodynamikkens andre lov.
Så har klimaforskere gjort en grunnleggende feil? Selvfølgelig ikke!
Jordens atmosfære er mindre i stand til å absorbere kortbølgestråling fra solen enn termisk stråling som kommer fra overflaten. Effekten av denne ulempen er at termisk stråling som rømmer ut til rommet kommer for det meste fra den kalde øvre atmosfæren, mens overflaten opprettholdes ved en vesentlig varmere temperatur. Dette kalles "atmosfærisk drivhuseffekt", og uten denne ville jordens overflate være mye kaldere.
Vi må bare huske på det faktum at jorden blir oppvarmet av solen, noe som utgjør hele forskjellen.
Varme fra solen varmer opp jorden, som varmen fra kroppen holder deg varm. Jorden mister varmen til verdensrommet, og kroppen din mister varmen til miljøet. Drivhusgasser reduserer hastigheten på varmetapet fra jordens overflate, som et teppe senker hastigheten når kroppen din mister varme. Resultatet er det samme i begge tilfeller, overflaten av jorden eller kroppen din blir varmere.
The second law of thermodynamics (12) has been stated in many ways. For us, Rudolf Clausius said it best:
"Heat generally cannot flow spontaneously from a material at lower temperature to a material at higher temperature."
So if you put something hot next to something cold, the hot thing won't get hotter, and the cold thing won't get colder. That's so obvious that it hardly needs a scientist to say it, we know this from our daily lives. If you put an ice-cube into your drink, the drink doesn't boil!
The skeptic tells us that, because the air, including the greenhouse gasses, is cooler than the surface of the Earth, it cannot warm the Earth. If it did, they say, that means heat would have to flow from cold to hot, in apparent violation of the second law of thermodynamics.
So have climate scientists made an elementary mistake? Of course not! The skeptic is ignoring the fact that the Earth is being warmed by the sun, which makes all the difference.
To see why, consider that blanket that keeps you warm. If your skin feels cold, wrapping yourself in a blanket can make you warmer. Why? Because your body is generating heat, and that heat is escaping from your body into the environment. When you wrap yourself in a blanket, the loss of heat is reduced, some is retained at the surface of your body, and you warm up. You get warmer because the heat that your body is generating cannot escape as fast as before.
If you put the blanket on a tailors dummy, which does not generate heat, it will have no effect. The dummy will not spontaneously get warmer. That's obvious too!
Is using a blanket an accurate model for global warming by greenhouse gases? Certainly there are differences in how the heat is created and lost, and our body can produce varying amounts of heat, unlike the near-constant heat we receive from the sun. But as far as the second law of thermodynamics goes, where we are only talking about the flow of heat, the comparison is good. The second law says nothing about how the heat is produced, only about how it flows between things.
Heat from the sun warms the Earth, as heat from your body keeps you warm. The Earth loses heat to space, and your body loses heat to the environment. Greenhouse gases slow down the rate of heat-loss from the surface of the Earth, like a blanket that slows down the rate at which your body loses heat. The result is the same in both cases, the surface of the Earth, or of your body, gets warmer.
How quantum mechanics explains global warming
You've probably heard that carbon dioxide is warming the Earth. But how exactly is it doing it? Lieven Scheire uses a rainbow, a light bulb and a bit of quantum physics to describe the science behind global warming.
1.a) First, we know there has been an increase in atmospheric CO2, and we know that this growth is due to human activities using the equation DC / Dt + Fa = Fi + Fe. Details here.
b) CO2 happens to be a special feature from nature. It absorbs heat radiation very effectively. It has to do with the vibratory and rotational properties of the molecule itself. In addition, carbon dioxide triggers a water vapor feedback, greatly amplifying the effect, as hot air can hold more water vapor than cold air. Ample physical evidence shows that carbon dioxide (CO2) is the single
most important climate-relevant greenhouse gas in Earth's atmosphere. This is
because CO2, like ozone, N2O, CH4, and chlorofluorocarbons, does not condense
and precipitate from the atmosphere at current climate temperatures, whereas
water vapor can, and does. Non-condensing greenhouse gases, which account for
25% of the total terrestrial greenhouse effect, thus serve to provide the
stable temperature structure that sustains the current levels of atmospheric
water vapor and clouds via feedback processes that account for the remaining
75% of the greenhouse effect. Without the radiative forcing supplied by CO2 and
the other non-condensing greenhouse gases, the terrestrial greenhouse would
collapse, plunging the global climate into an icebound Earth state.
c) As a result of this study, a more accurate calculation of CO2 absorption can be made, permitting a more precise determination of greenhouse warming due to CO2.
d) Henry's law
2.a) Volcanoes also emit hydrogen chloride (3 million tons/year) and hydrogen fluoride (11 million tons/year), both of which can react with organic compounds to produce organohalogens. Chlorofluorocarbons have been detected in volcanic emissions in Guatemala and Siberia, but a study of volcanoes in Italy and Japan indicates that they may not be a major source of environmental CFCs.
b) IPCC/TEAP (2005) concluded that the combined CO2-equivalent emissions of CFCs, HCFCs and HFCs decreased from a peak of about 7.5 GtCO2-eq yr–1 in the late 1980s to about 2.5 GtCO2-eq yr–1 by the year 2000, corresponding to about 10% of that year’s CO2 emissions due to global fossil fuel burning. (AR4) Climate Change 2007: The Physical Science Basis. Montreal Protocol Gases: page 145:)
c) Lu (2013) (L13) argued that solar effects and anthropogenic halogenated gases can explain most of the observed warming of global mean surface air temperatures since 1850, with virtually no contribution from atmospheric carbon dioxide (CO2) concentrations. Here we show that this conclusion is based on assumptions about the saturation of the CO2-induced greenhouse effect that have been experimentally falsified.
http://www.worldscientific.com/doi/abs/10.1142/S0217979214820037
3.a) The Suess effect.
http://www.oxfordreference.com/view/10.1093/oi/authority.20110803100540909
http://www.nature.com/nature/journal/v280/n5725/abs/280826a0.html?foxtrotcallback=true
b) IPCC Fourth Assessment Report (AR4) Climate Change 2007: The Physical Science Basis page 139:Thus, as shown in Prentice et al. (2001), when CO2 from fossil fuel combustion enters the atmosphere, the 13C/12C isotopic ratio in atmospheric CO2 decreases at a predictable rate consistent with emissions of CO2 from fossil origin. Note that changes in the 13C/12C ratio of atmospheric CO2 are also caused by other sources and sinks, but the changing isotopic signal due to CO2 from fossil fuel combustion can be resolved from the other components (Francey et al., 1995).
c) Additional confirmation that rising CO2 levels are due to human activity comes from examining the ratio of carbon isotopes found in the atmosphere. Carbon 12 has 6 neutrons, carbon 13 has 7 neutrons. Plants have a lower C13/C12 ratio than in the atmosphere. If rising atmospheric CO2 comes from fossil fuels, the C13/C12 should be falling. Indeed this is what is occurring (Ghosh 2003). The C13/C12 ratio correlates with the trend in global emissions. (Bohm et al. 2002;Wei et al. 2009).
d) An overview of the main global carbon cycle components
http://www-naweb.iaea.org/napc/ih/documents/global_cycle/vol%20II/cht_ii_06.pdf
Can C3 Plants Faithfully Record the Carbon Isotopic Composition of AtmosphericCarbon Dioxide?
e) Measurements of carbon isotopes and falling oxygen in the atmosphere show that rising carbon dioxide is due to the burning of fossil fuels and cannot be coming from the ocean. https://www.skepticalscience.com/co2-coming-from-ocean.htm
Isotopic characterisation of anthropogenic CO2 emissions using isotopic and radiocarbonanalysis
https://www.sciencedirect.com/science/article/pii/S0079194697811469
f) Evolution of natural and anthropogenic fluxes of atmospheric CO2 from 1957 to 2003
http://www.rescuethatfrog.com/wp-content/uploads/2017/03/Keeling-et-al-2011.pdf
g) By the 1980s, most of the “bomb” 14C had been absorbed into the oceans and land biota, leaving slightly elevated levels in the atmosphere. Yet atmospheric 14C levels continue to decrease–now because of fossil fuel CO2 emissions. https://www.esrl.noaa.gov/gmd/outreach/isotopes/bombspike.html
Moreover, the anthropogenic disturbance of 14C through atmospheric bomb tests has served as an invaluable tracer to get insight into the global carbon cycle on the decadal time scale. Levin, Ingeborg ; Hesshaimer, Vago 2000.
4.a) Keeling, R.F., S.C. Piper, A.F. Bollenbacher and J.S. Walker. 2008. Atmospheric CO2 records from sites in the SIO air sampling network. In Trends: A Compendium of Data on Global Change. Carbon Dioxide Information Analysis Center, Oak Ridge National Laboratory, U.S. Department of Energy, Oak Ridge, Tenn., U.S.A.
- Atmospheric Carbon Dioxide Record from Mauna Loa
- Atmospheric Carbon Dioxide Record from Christmas Island, Kiribati
- Atmospheric Carbon Dioxide Record from Alert, Northwest Territories, Canada
- Atmospheric Carbon Dioxide Record from Baja California Sur, Mexico
c) Keeling, C. D., T. P. Whorf, M. Wahlen, and J. van der Plicht 1995, Interannual extremes in the rate of rise of atmospheric carbon dioxide since 1980, Nature, 375, 666–670.
5.a) All studies to date of global volcanic carbon dioxide emissions indicate that present-day subaerial and submarine volcanoes release less than a percent of the carbon dioxide released currently by human activities. https://volcanoes.usgs.gov/vhp/gas_climate.html
b) The projected 2010 anthropogenic CO2 emission rate of 35 gigatons per year is 135 times greater than the 0.26-gigaton-per-year preferred estimate for volcanoes. https://volcanoes.usgs.gov/vsc/file_mngr/file-154/Gerlach-2011-EOS_AGU.pdf
c) Deep Carbon Emissions from Volcanoes: http://rimg.geoscienceworld.org/content/75/1/323
6. a) VOLCANIC VERSUS ANTHROPOGENIC CARBON DIOXIDE: AN ADDENDUM
"What would need to happen to explain the increase of carbon dioxide with an accompanying decrease in its isotopic composition? Well, if you want it to be volcanoes, then you would need both a sharp increase in volcanic emissions since 1800 and a change in the composition of the carbon dioxide they emit, from around -3 to -5‰ to something much more negative. This has not happened
b) Crucially however, these aerosols had no discernible effect on many other cloud properties, including the amount of liquid water that the clouds hold and the cloud amount. The team believe the research shows that cloud systems are "well buffered" against aerosol changes in the atmosphere.
Role aerosols play in climate change unlocked by spectacular Icelandic volcanic eruption.
7.Natural factors (volcanoes, solar cycle) influencing the trend are very small in comparison to anthropogenic CO2 (as e.g. standard correlation analyses show, see for example Lean and Rind 2008, Foster and Rahmstorf 2011). The IPCC AR5 found their contribution to global temperature change since 1951 to be in the range of −0.1°C to 0.1°C.
8.a) So, in summary, we know that heating is happening, we know why it happens and we know that it's likely to have negative consequences for biodiversity and for economy food and safety for humans. Meehl et al 2003. Shows that natural variation is not sufficient to explain the climate towards the end of the 19th century, thus human forcings are requird.
b) The earth’s climate is constrained by well-known and elementary physical principles, such as energy balance, flow, and conservation. Greenhouse gases affect the atmospheric optical depth for infrared radiation, and increased opacity implies higher altitude from which earth’s equivalent bulk heat loss takes place. Such an increase is seen in the reanalyses, and the outgoing long-wave radiation has become more diffuse over time, consistent with an increased influence of greenhouse gases on the vertical energy flow from the surface to the top of the atmosphere. Benestad 2016.
d) The Greenhouse Effect
e) A mental picture of the greenhouse effect. Benestad 2016
f) Ample physical evidence shows that carbon dioxide (CO2) is the single most important climate-relevant greenhouse gas in Earth's atmosphere. This is because CO2, like ozone, N2O, CH4, and chlorofluorocarbons, does not condense and precipitate from the atmosphere at current climate temperatures, whereas water vapor can, and does. Non-condensing greenhouse gases, which account for 25% of the total terrestrial greenhouse effect, thus serve to provide the stable temperature structure that sustains the current levels of atmospheric water vapor and clouds via feedback processes that account for the remaining 75% of the greenhouse effect. Without the radiative forcing supplied by CO2 and the other non-condensing greenhouse gases, the terrestrial greenhouse would collapse, plunging the global climate into an icebound Earth state.
g) https://en.wikipedia.org/wiki/Clausius%E2%80%93Clapeyron_relation
9.a) we can calculate the effective temperature of the Earth by equating the energy received from the Sun and the energy radiated by the Earth. Stefan–Boltzmann law
b) Then we know that the warming is due to the increase in greenhouse effect measured from direct satellite measurements of reduced Outgoing Longwave Radiation (OLR) (John E. Harries et al 2001)in the specific wavelengths absorbed by CO2 (and others). Spectral signatures of climate change in the Earth’s infrared spectrum between 1970 and 2006
c) Increased greenhouse gasses reduce the transmission of Outgoing Longwave Radiation (OLR) to space along spectral absorption lines eventually causing the Earth’s temperature to rise in order to preserve energy equilibrium. This greenhouse forcing effect can be directly observed in the Outgoing Longwave Spectra (OLS) from space-borne infrared instruments with sufficiently high resolving power. A decade of measured greenhouse forcings from AIRS. D. Chapman ; P. Nguyen ; M. Halem 2013
d) Comparison of spectrally resolved outgoing longwave databetween 1970 and present. Griggs, J. A., & Harries, J. E. (2004)
e) The changes of the outgoing longwave radiation (OLR) in clear-sky conditions have been calculated using High Resolution Infrared Radiation Sounder (HIRS) observations from 1979 to 2004.[...] The observed increase in GHE is shown to be inconsistent with the control ensemble, indicating that anthropogenic forcings are required to reproduce the observed changes in GHE. Satellite-Based Reconstruction of the Tropical Oceanic Clear-Sky Outgoing Longwave Radiation and Comparison with Climate Models. Guillaume Gastineau et al 2013.
f) This is further supported by direct measurements of an increase in decreasing reflective LR (PDF) as well, supported by more empirical evidence. MEASUREMENTS OF THE RADIATIVE SURFACE FORCING OF CLIMATE. W.F.J. Evans at al.
g) Global atmospheric downward longwave radiation over land surface under all-sky conditions from 1973 to 2008.
h) We have shown that longwave downward radiation flux increases at Earth's surface can be accurately measured, subdivided and explicitly explained and backed with model calculations as cloud-, temperature-, water vapour- and enhanced greenhouse gas radiative forcing effect. Radiative forcing - measured at Earth's surface - corroborate the increasing greenhouse effect. Philipona et al 2004
i) These results confirm theoretical predictions of the atmospheric greenhouse effect due to anthropogenic emissions, and provide empirical evidence of how rising CO2 levels, mediated by temporal variations due to photosynthesis and respiration, are affecting the surface energy balance. Observational determination of surface radiative forcing by CO2 from 2000 to 2010. Feldman et al 2015
j). Studies: atmospheric CO2 drives climate change ancient and modern.
On the causal structure between CO2 and global temperature
10. Spectroscopy Introduction:
11. a) Watervapor feedback and Global Warming. Isaac M. Held and Brian J. Soden
Water vapor is the dominant greenhouse gas, the most important gaseous source of infrared opacity in the atmosphere. As the concentrations of other greenhouse gases, particularly carbon dioxide, increase because of human activity, it is centrally important to predict how the water vapor distribution will be affected.
b) Anthropogenic greenhouse forcing and strong water vapor feedback increase temperature in Europe. Rolf Philipona, Bruno Dürr,Atsumu Ohmura, Christian Ruckstuhl
b) The Real Second Law of Thermodynamics.
Entropy is a conceptually difficult subject, but all of us can see the
example in “the special case” and agree that the picture is
correct.However, the atmosphere – surface interaction is more complex
than that simple case. The surface of the earth receives energy from the
sun and the atmosphere.As we have seen, in simple examples of radiant
heat exchange between two bodies, entropy is still positive even when
the hotter body absorbs energy from the colder body. This is because
more energy flows from the hotter to the colder than the reverse.To
prove that the second law of thermodynamics has been violated someone
needs to demonstrate that a system is reducing entropy. So we would
expect to see an entropy calculation.Turgid undergraduate books about heat transfer in university libraries all write that radiation
emitted by a colder body is absorbed by a hotter body. That is because
the first law of thermodynamics is still true – energy cannot be
created, destroyed, or magically lost. Det
er ingen motsetning mellom naturlige og menneskeskapte
klimaendringer/variasjoner. Tvert imot, kraftige naturlige svingninger
viser bare at det skal lite til. Det er alltid fysiske årsaker bak. Den
globale oppvarmingen øker fordampningen og øker takten på vannets
kretsløp.
13. a) The Orbiting Carbon Observatory-2 early science investigations of regional carbon dioxide fluxes http://science.sciencemag.org/content/358/6360/eaam5745
b) Spaceborne measurements of atmospheric CO2 using kilometer-scale data from NASA’s Orbiting Carbon Observatory-2 (OCO-2) reveal distinct structures caused by known anthropogenic and natural point sources, including megacities and volcanoes. http://science.sciencemag.org/content/358/6360/eaam5782
c) https://forskning.no/klima-miljoovervakning-satellitter-miljoteknologi/2017/10/co2-utslipp-kan-na-males-presist-fra

