- The average annual temperature for the European land area for the last decade (2007–2016) was around 1.6 °C above the pre-industrial level, which makes it the warmest decade on record. Moreover, 2016 was the second warmest year (after 2014) in Europe since instrumental records began.
- Climate models project further increases in global average temperature over the 21st century (for the period 2081–2100 relative to 1986–2005) of between 0.3 and 1.7 °C for the lowest emissions scenario (RCP2.6) and between 2.6 and 4.8 °C for the highest emissions scenario (RCP8.5).
- All UNFCCC member countries have agreed on the long-term goal of keeping the increase in global average temperature to well below 2 °C compared with pre-industrial levels and have agreed to aim to limit the increase to 1.5 °C. For the three highest of the four RCPs, global average temperature increase is projected to exceed 2 °C compared with pre-industrial levels by 2050.
- Annual average land temperature over Europe is projected to increase by the end of this century (2071–2100 relative to 1971–2000) in the range of 1 to 4.5 °C under RCP4.5 and 2.5 to 5.5 °C under RCP8.5, which is more than the projected global average increase. The strongest warming is projected across north-eastern Europe and Scandinavia in winter and southern Europe in summer.
- The number of warm days (those exceeding the 90th percentile threshold of a baseline period) have doubled since 1960 across the European land area.
- Europe has experienced several extreme heat waves since 2000 (2003, 2006, 2007, 2010, 2014 and 2015). Under a high emissions scenario (RCP8.5), extreme heat waves as strong as these or even stronger are projected to occur as often as every two years in the second half of the 21st century. In southern Europe they are projected to be particularly strong.
https://www.eea.europa.eu/data-and-maps/indicators/global-and-european-temperature-4/assessment
Lets check around the word. Are the different meterological institutions in tune with the global trend NASA shows us?
Spain. What warming have they had? Average temperature in the last 100 years has risen slightly more in Spain than the rest of the EU: 1 ºC compared with 0.9 ºC. This increase has been as much as 2 ºC in regions such as Murcia (8). https://www.climatechangepost.com/spain/climate-change/
Japan.
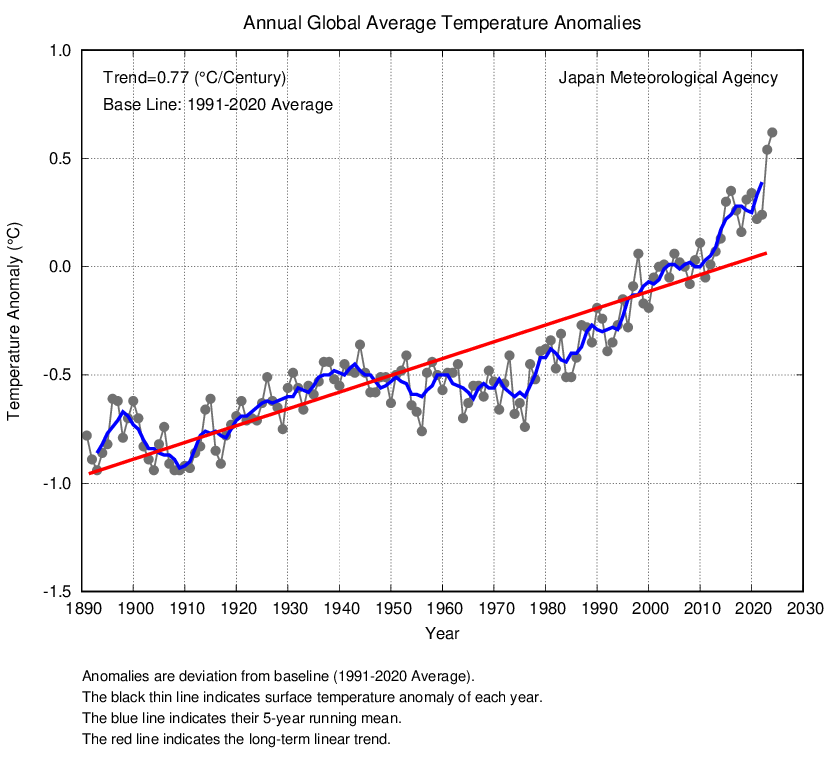
The annual anomaly of the global average surface temperature in 2017 (i.e. the average of the near-surface air temperature over land and the SST) was +0.38°C above the 1981-2010 average (+0.74°C above the 20th century average), and was the 3rd warmest since 1891. On a longer time scale, global average surface temperatures have risen at a rate of about 0.73°C per century.
http://ds.data.jma.go.jp/tcc/tcc/products/gwp/temp/ann_wld.html

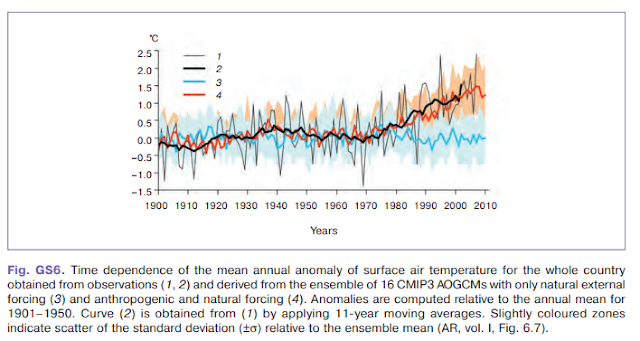
Lets go east to Russia: According to observations provided by the meteorological network of Roshydromet, the warming in Russia was 1.29°C for the last 100 years (1907–2006). https://www.climatechangepost.com/russia/climate-change/
In Cyprus in the
Mediterranean Sea we find the same warming: Overall, a warming of approximately
1‐1.58°C has been observed over the
20th century.
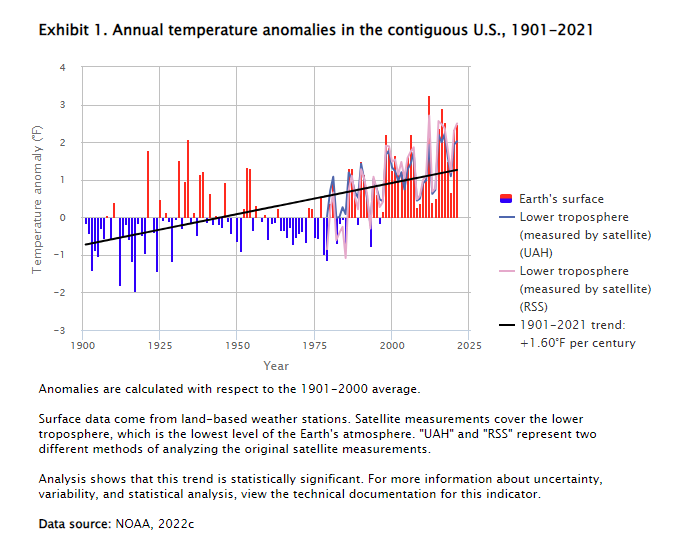
NASA data for the US are in tune with european data: Since consistent record-keeping began in 1895, the average temperature in the United States has increased by 1.3 to 1.9 degrees Fahrenheit (0.8 to 1.1° Celsius), and most of that change has happened since 1970. The warmest year on record for the United States was 2012.
https://earthobservatory.nasa.gov/IOTD/view.php?id=83624
https://www.statista.com/statistics/500515/annual-average-temperature-in-the-us-celsius/
What about Canada? According to ECCC "warming over the 20th century is indisputable and largely due to human activities" adding "Canada's rate of warming is about twice the global rate: a 2°C increase globally means a 3 to 4ºC increase for Canada". Berkeley Earth has reported that 2015 was "unambiguously" the warmest year on record across the world, with the Earth’s temperature more than 1.0 C (1.8 F) above the 1850-1900 average.
Causes and effects of climate change - Canada.ca
ALASKA:
Alaska has warmed twice as fast as the rest of the nation, bringing widespread impacts. Sea ice is rapidly receding and glaciers are shrinking. Thawing permafrost is leading to more wildfire, and affecting infrastructure and wildlife habitat. Rising ocean temperatures and acidification will alter valuable marine fisheries.
https://nca2014.globalchange.gov/report/regions/alaska
The temperature change varies from one climatic zone to another as well as for different seasons. If a linear trend is taken through mean annual temperatures, the average change over the last 6 decades is around 3.0°F.
http://climate.gi.alaska.edu/ClimTrends/Change/TempChange.html
2016 shatters record for Alaska's warmest year
Temperatures in Alaska were well above normal across the entire state in 2016.
Warmer-than-average days outnumbered colder-than-average days by a ratio of 9 to 1.
https://www.climate.gov/news-features/features/2016-shatters-record-alaskas-warmest-year
Lets jump all the way down to Australia.WOW, their government tells the same story: In Australia, average air temperatures have increased by around 0.9 degrees Celsius since 1910, and each decade has been warmer than the previous decade since the 1950s. Seems pretty clear to me that the globe is warming globally.
Lets jump all the way down to Australia.WOW, their government tells the same story: In Australia, average air temperatures have increased by around 0.9 degrees Celsius since 1910, and each decade has been warmer than the previous decade since the 1950s. Seems pretty clear to me that the globe is warming globally.
http://www.environment.gov.au/climate-change/climate-science/understanding-climate-change
http://www.bom.gov.au/climate/change/#tabs=Tracker&tracker=timeseries
https://theconversation.com/factcheck-was-the-1896-heatwave-wiped-from-the-record-33742
http://www.bom.gov.au/climate/change/#tabs=Tracker&tracker=timeseries
https://theconversation.com/factcheck-was-the-1896-heatwave-wiped-from-the-record-33742
Here are New Zealand temp trend from their latest report in 2017:
New Zealand’s annual average land-surface temperature (measured 1.3 metres above the
ground) has increased 1 degree Celsius since 1909, when measurements first began. This is
consistent with the lower end of the global average increase of land temperature over a
similar period (1–1.2 degrees Celsius from 1880 to 2012) due to the moderating
influence of our oceanic location.
England : From 1901 to 1999, annual mean CET temperatures showed a warming of +0.6°C over this period. The warming has been greatest from mid-summer to late autumn: July (+ 0.8°C), August (+ 1.2°C), September (+0.9°C), October (+ 1.2°C) and November (+ 1.3°C) respectively. With the exception of March (+ 1.0°C), the remaining months showed no statistically significant warming over the century (7). After a period of relative stability for most of the 20th century, CET has increased by about a degree Celsius since the 1970s (1). Eight of the ten warmest years recorded have been since 1990 with 2006 being the warmest year on record (3).
Studies have shown that this observed rate of
warming cannot be explained by natural climate variations, but is consistent
with the response to increasing greenhouse gases and aerosols simulated by the
Met Office Hadley Centre climate model. It is likely, therefore, that global
man-made emissions of greenhouse gases have played a significant role in the
recent warming of the UK (1).
https://www.climatechangepost.com/united-kingdom/climate-change/
https://www.metoffice.gov.uk/climate/uk/summaries/actualmonthly
https://www.metoffice.gov.uk/climate/uk/summaries/actualmonthly
BRAZIL
Data from CRU 3.1 dataset showing the change in June-July average temperature anomalies in Brazil for 1950-2009.
June-July average temperatures have risen at a rate of 0.3°F per decade since 1950 in Brazil. Much of that rise has come since the 1970s, which is in line with the overall global trend. The analysis is based on temperature anomaly data processed using the International Research Institute for Climate and Society’s Data Library. That same data also show yearly temperatures have also risen roughly 1.4°F since 1950.
Denmark. What are their meterological weather stations telling us? Here are their observations since 1870: The ten warmest years are spread from the 30s and up to now. In fact, almost every year since 1988, it has been warmer than usual, where "normally" is defined as the average for the period 1961-90. And the land temperature has shown a sharp rise in recent decades. Since 1870 the temperature in Denmark has increased by about 1.5 ° C. IOW, data from Denmark confirms europes Copernicus's data and complies with what NASA has concluded globally. And that the temperature has risen sharply in the last 10 years.
http://www.dmi.dk/klima/klimaet-frem-til-i-dag/danmark/temperatur/
KINA:

Chinas temperature trend looks very much like the global one.
Berkeley Earth
Berkeley Earth
More on GW:
The following table lists the global combined land and ocean annually-averaged temperature rank and anomaly for each of the 12 warmest years on record (2003, 2006, and 2007 tie as 10th warmest).

KINA:
Chinas temperature trend looks very much like the global one.
Berkeley Earth
Berkeley Earth
More on GW:
The following table lists the global combined land and ocean annually-averaged temperature rank and anomaly for each of the 12 warmest years on record (2003, 2006, and 2007 tie as 10th warmest).


Ingen kommentarer:
Legg inn en kommentar