Mid-century cooling in the 20th Century: skeptics point to it and ask about it. What's the real story?
As a preface, scientists have evaluated all natural forcings and factors capable of driving the Earth's climate to change and it is only when the anthropogenic forcing is included that the ongoing observed warming can be explained.
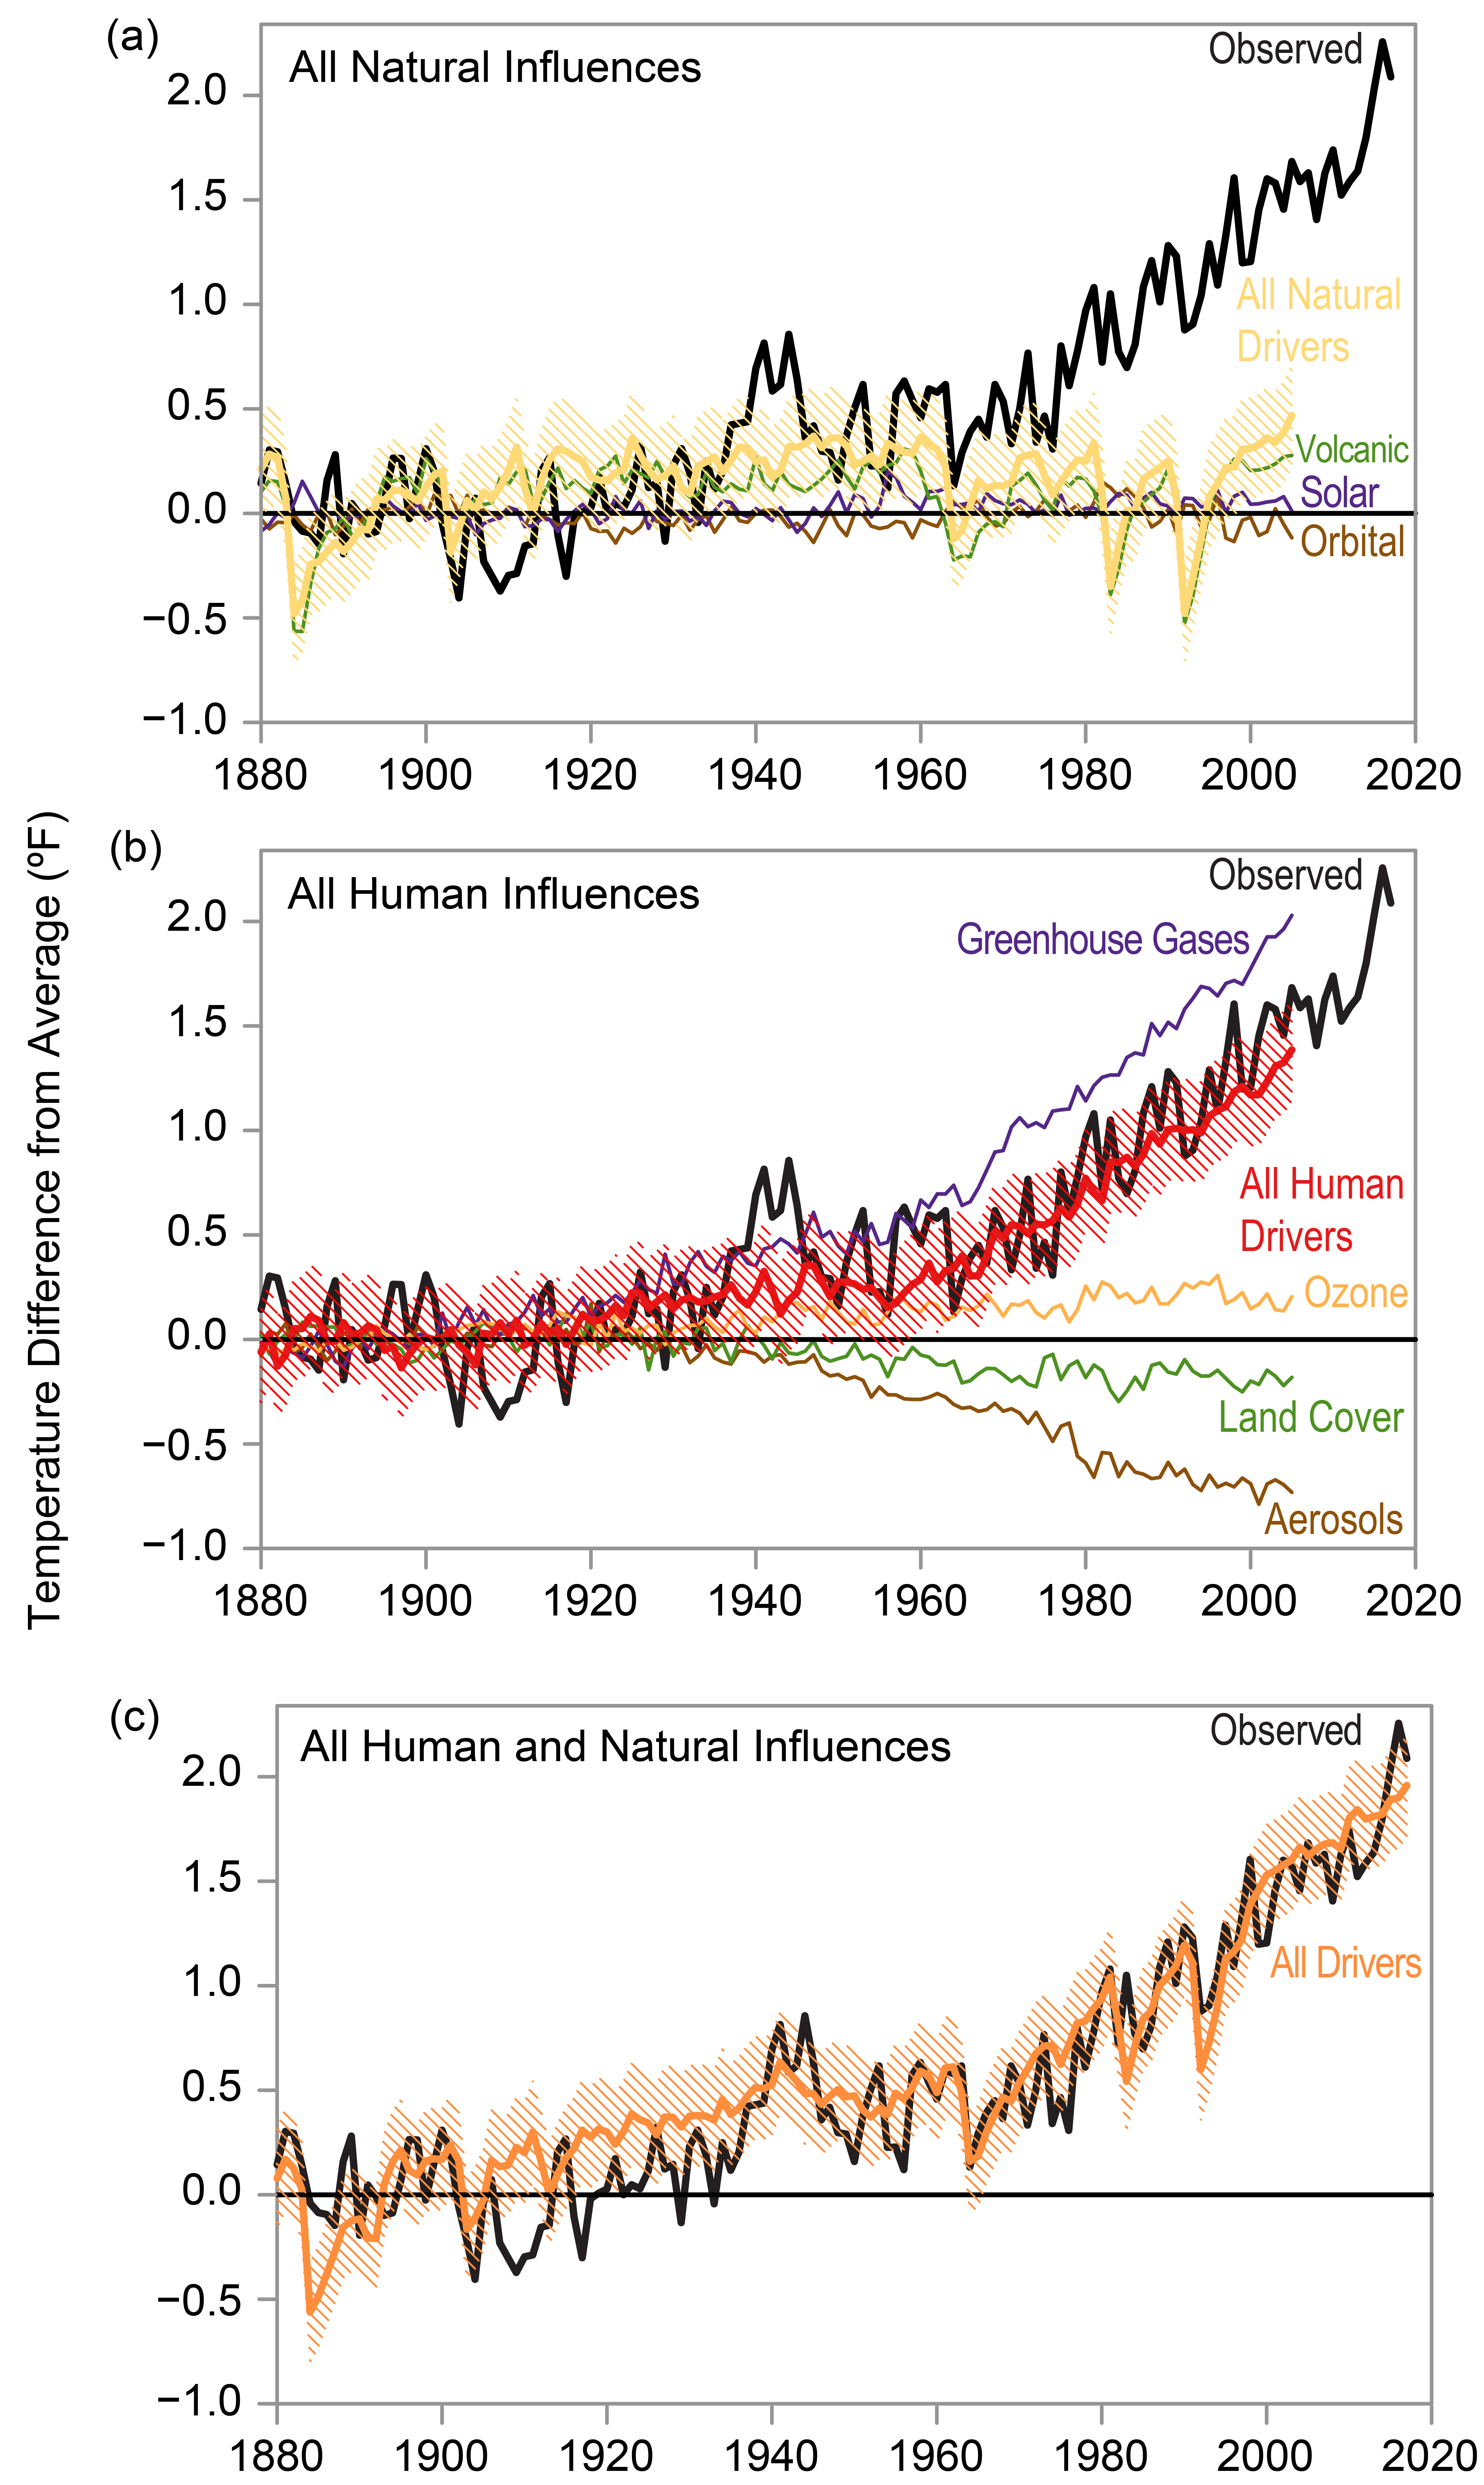
Natural vs Anthropogenic Climate Forcings, per the NCA4, Volume 2:
https://nca2018.globalchange.gov/img/figure/figure2_1.png
https://journals.ametsoc.org/doi/abs/10.1175/JCLI-D-18-0555.1
https://www.osti.gov/biblio/15020102
https://www.tandfonline.com/doi/abs/10.3402/tellusa.v43i4.11944
https://agupubs.onlinelibrary.wiley.com/doi/full/10.1029/2006GL028031
Looking at the temperature trends of both the Northern and Southern Hemispheres, if both CO2 and sulfate aerosol emissions were rising, we’d expect to see greater cooling in the Northern Hemisphere than in the Southern Hemisphere, which is exactly what we observe:

https://data.giss.nasa.gov/gistemp/graphs/graph_data/Hemispheric_Temperature_Change/graph.png
By the end of the 1970s, the cleaning of the air due to the passage of the Clean Air Act of 1970 (which limited sulfate aerosol emissions from industry), coupled with the significant increase in CO2 emissions from human activities combined to drive global surface temperatures upwards.
https://19january2017snapshot.epa.gov/clean-air-act-overview/clean-air-act-requirements-and-history_.html
Since 1980 alone, annual global CO2 emissions have doubled:
https://ourworldindata.org/co2-and-other-greenhouse-gas-emissions#co2-emissions-global-and-regional-trends
As a result, global temperatures spiked, with the rise ongoing still today, unabated:

Digging into the question, early 20th Century warming (1910-1940) was about one-third caused by human activities. The rest of that was a combination of natural factors. Starting in the war years (1940) and continuing through the 1970s, sulfate aerosol emissions (which act to reflect incoming sunlight, cooling the Earth’s surface) combined with natural cooling held daytime temperatures flat, despite increasing CO2 and other GHG emissions from human activities. However, during this time nighttime low temperatures continued to increase, a hallmark confirmation of the combined effects of increases in GHG emissions from human activities coupled with sulfate aerosol emissions from industrial activities (the explosions during WW2 and the post-war reconstruction boom in industrial activities).
https://journals.ametsoc.org/doi/abs/10.1175/JCLI-D-18-0555.1
https://www.osti.gov/biblio/15020102
https://www.tandfonline.com/doi/abs/10.3402/tellusa.v43i4.11944
https://agupubs.onlinelibrary.wiley.com/doi/full/10.1029/2006GL028031
Looking at the temperature trends of both the Northern and Southern Hemispheres, if both CO2 and sulfate aerosol emissions were rising, we’d expect to see greater cooling in the Northern Hemisphere than in the Southern Hemisphere, which is exactly what we observe:

By the end of the 1970s, the cleaning of the air due to the passage of the Clean Air Act of 1970 (which limited sulfate aerosol emissions from industry), coupled with the significant increase in CO2 emissions from human activities combined to drive global surface temperatures upwards.
https://19january2017snapshot.epa.gov/clean-air-act-overview/clean-air-act-requirements-and-history_.html
Since 1980 alone, annual global CO2 emissions have doubled:
https://ourworldindata.org/co2-and-other-greenhouse-gas-emissions#co2-emissions-global-and-regional-trends
As a result, global temperatures spiked, with the rise ongoing still today, unabated:

“climate scientists have had a difficult time explaining exactly what caused a warming event in the early 20th century, between about 1910 and 1945. “[…] The new study, published in the Journal of Climate, tackles the discrepancy in part by addressing an issue with ocean temperature data during the second world war, when measurements were more often made from warmer engine room intakes than from buckets lowered over the side of ships. This has resulted in a bias, inflating estimated surface temperatures in the early-to-mid 1940s. The new study removed this bias by focusing on temperatures along continental and island coastlines.[…]They found that the 0.4C warming from 1910 to 1945 could be accounted for by 0.2C warming from human greenhouse gases offset by 0.08C cooling from human aerosol pollution, 0.2C warming from natural factors (mostly a quiet period for volcanic activity plus a small contribution from increased solar activity), and a bit of natural variability plus some remaining uncertainty in the data.Since 1950, the authors found that the 0.8C temperature rise is due to 1.2C warming from greenhouse gases offset by 0.3C cooling from human aerosol pollution and 0.1C cooling from volcanoes and the sun.These findings are important because they improve global surface temperature estimates, explain the causes of the early-20th century warming, and reaffirm that as the IPCC concluded in 2013, humans are responsible for all of the rapid global heating since 1950.”


Ingen kommentarer:
Legg inn en kommentar