“When we look at all the natural causes today - changes in energy from the sun, orbital cycles, natural cycles like El Nino, volcanic and other geologic activity - each and every one of those natural causes has an alibi”.
“According to natural factors, we should be cooling right now, not warming. So they can’t be responsible for our current warming trend.”
(Climate scientist Katharine Hayhoe.)
The moment when natural climate change became AGW! The huge blue spike to the right. It’s that obvious.
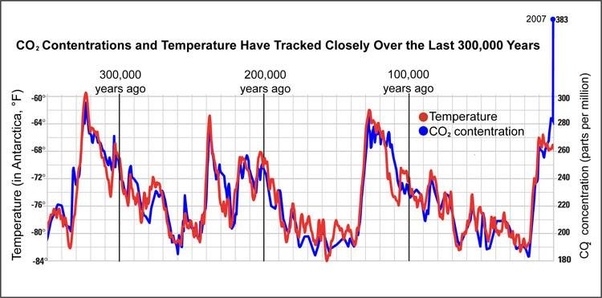
WE have changed the natural slow cooling trend. If it was “climate has always changed and natural cycles, BOTH C02 LEVELS AND TEMPERARURE SHOULD GO DOWN NOW!!


Nature does what it does. Extra carbon dioxide, extra greenhouse effect. Extra greenhouse effect, higher mean global temperature. Its basic physics which follows the same principles as other laws of nature.

The 10 Hottest Global Years on Record
For 400 Months in a Row, the Earth Has Been Warmer Than 20th Century Average
Last four years are 'world's hottest'
Some aspects of the science of AGW are known with near 100% certainty. The greenhouse effect itself is as established a phenomenon as any: it was discovered in the 1820s and the basic physics was essentially understood by the 1950s.
CONTENT
It’s so trivial 5th graders can demonstrate GHE at home:
John Tyndall's experiments also showed that molecules of water vapor, carbon dioxide, and ozone are the best absorbers of heat radiation, and that even in small quantities, these gases absorb much more strongly than the atmosphere itself.
Iain Stewart demonstrates a simple experiment that shows that carbon dioxide absorbs infrared radiation. Scene from BBC's 'Earth: The Climate Wars' documentary:
2. Anyone can take out their spectroscopes and see with their own eyes that C02 traps heat that would otherwise escape into space.
Spectroscopy is a method of detecting elements by looking at how electromagnetic radiation passes through them. Different elements have electrons in orbits at varying energy levels, and this affects the way they resonate. It's the reason why neon lights produce different colors depending on what gases we fill them with. It's also the way we're able to tell what proportions of hydrogen, helium, and other elements are in distant stars: the spectrum of light coming from them has peaks and valleys that are chemical fingerprints of exactly what gases are in them.


https://ams.confex.com/ams/pdfpapers/100737.pdf
The Simple Proof of Man-Made Global Warming
3. HOW DO WE KNOW ITS OUR CO2 CAUSING THE WARMING?
The carbon in the atmospheric CO2 contains information about its source, so that scientists can tell that fossil fuel emissions comprise the largest source of the increase since the pre-industrial era.
How do we know that recent CO2 increases are due to human activities?
Global warming isn’t natural, and here’s how we know
The carbon from burning fossil fuels have a different isotope signal (radioactivity) than C02 coming from natural sources. Its like a fingerprint. Its the carbons "DNA". Its unique.
Here’s how scientists know.

The Suess Effect is a term which has come to signify the decrease in 14C in atmospheric CO2 owing to admixture of CO2 produced by the combustion of fossil fuels. This term is here extended, as a concept, to the shifts in isotopic ratio of both 13C and 14C in any reservoir of the carbon cycle owing to anthropogenic activities.
The Suess effect: 13Carbon-14Carbon interrelations
Changes in the 13C/12C ratio of atmospheric CO2 are also caused by other sources and sinks, but the changing isotopic signal due to CO2 from fossil fuel combustion can be resolved from the other components (Francey et al., 1995).
http://bluemoon.ucsd.edu/publications/ralph/25_Partition.pdf
Additional confirmation that rising CO2 levels are due to human activity comes from examining the ratio of carbon isotopes found in the atmosphere. Carbon 12 has 6 neutrons, carbon 13 has 7 neutrons. Plants have a lower C13/C12 ratio than in the atmosphere. If rising atmospheric CO2 comes from fossil fuels, the C13/C12 should be falling. Indeed this is what is occurring (Ghosh 2003). The C13/C12 ratio correlates with the trend in global emissions.
http://www.bgc.mpg.de/service/iso_gas_lab/publications/PG_WB_IJMS.pdf
Orbiting Carbon Observatory-2 (OCO-2): NASA's New Carbon Counter
2. WHAT THE BEST PEER REVIEWED SCIENCE SAYS:
From about 1880 our C02 emissions started to dominate CC , and after 1950, according to scientists, humans ARE the dominant cause of CC.

Fourth National Climate Assessment (NCA4), Volume I peer reviewed by the National Academy of Sciences, the world’s most prestigious academy, founded by Abraham Lincoln, with over 200 Nobel Price winners among their members.
This report is an authoritative assessment of the science of climate change, with a focus on the United States. It represents the first of two volumes of the Fourth National Climate Assessment, mandated by the Global Change Research Act of 1990.
The 600 page report was created from input by scientists working at 13 different federal government agencies.
Fourth National Climate Assessment: Executive Summary

IPCC:

https://www.ipcc.ch/pdf/assessment-report/ar5/syr/AR5_SYR_FINAL_SPM.pdf
Global warming: why is IPCC report so certain about the influence of humans? | Dana Nuccitelli

https://www.ipcc.ch/pdf/assessment-report/ar4/wg1/ar4-wg1-chapter2.pdf
NASA:
The evidence for rapid climate change is compelling:
The planet's average surface temperature has risen about 1.62 degrees Fahrenheit (0.9 degrees Celsius) since the late 19th century, a change driven largely by increased carbon dioxide and other human-made emissions into the atmosphere.
Most of the warming occurred in the past 35 years, with the five warmest years on record taking place since 2010. Not only was 2016 the warmest year on record, but eight of the 12 months that make up the year — from January through September, with the exception of June — were the warmest on record for those respective months.
Climate change evidence: How do we know?
COPERNICUS:
Average temperatures for 2017 were higher than climatological values for 1981-2010 over virtually all of Europe.
Climate in 2017 - European temperature

OBSERVATIONS:
First Direct Observation of Carbon Dioxide’s Increasing Greenhouse Effect at the Earth’s Surface
"the critical link between c02 concentrations and the addition of energy to the system, or the greenhouse effect [...] and further confirmation that the calculations used in today’s climate models are on track when it comes to representing the impact of CO2.”
Observational determination of surface radiative forcing by CO2 from 2000 to 2010
Studies: atmospheric CO2 concentration drives climate change
On the causal structure between CO2 and global temperature
Studies: atmospheric CO2 drives climate change ancient and modern.
99.999% certainty humans are driving global warming: new study
ScienceDirect
CO₂ and other Greenhouse Gas Emissions
https://www.c2es.org/facts-figures/international-emissions/historical
https://www.ipcc.ch/pdf/assessment-report/ar5/syr/SYR_AR5_FINAL_full_wcover.pdf
The Keeling Curve
Rising Global Temperatures and CO2

https://stephenschneider.stanford.edu/Publications/PDF_Papers/shaviv-veizer-03.pdf
3. Whats different with the climate change we have now?
1 degree C warming, in only a hundred years, is twenty times faster than the climate changes the Earth experienced when it thawed after the last ice age, and in the OPPOSITE direction to the natural slow cooling trend we were supposed to be on, and in the OPPOSITE direction to the natural slow cooling trend we were supposed to be on. The increase of atmosphere C02 from 280 ppm in 1880 to 407 ppm we have today, would normally take thousands of years. Its the highest C02 ppm for millions of years.
407 - 280 = 127
( 127 / 280 ) * 100 = 45.36 %
45% of the C02 up there is ours now..
We see very rapid warming, in the OPPOSITE direction of the natural slow cooling trend. The increase is happening at a time when, naturally, carbon dioxide levels and temperature should be decreasing.
THE RAPID INCREASE IN C02 SINCE THE POST INDUSTRIAL ERA WOULD NATURALLY TAKE THOUSANDS OF YEARS
For the 800,000 years we have records of, average global CO2 levels fluctuated between about 170 ppm and 280 ppm. Once humans started to burn fossil fuels in the industrial era, things changed rapidly.
Only in the industrial era has the number risen above 300 ppm. The concentration first crept above 400 ppm in 2013, and continues to climb.
Look at the spike and dramatic change of pattern to the right. Thats because of us.

Climate change evidence: How do we know?
Scientists debate the last time CO2 levels were this high. It might have happened during the Pliocene era, between 2 and 4.6 million years ago, when sea levels were at least 60 to 80 feet higher than today. It may have been in the Miocene, 10 to 14 million years ago, when seas were more than 100 feet higher than now.
In our 800,000-year record, it took about 1,000 years for CO2 levels to increase by 35 ppm. We're currently averaging an increase of more than 2 ppm per year, meaning that we could hit an average of 500 ppm within the next 45 years, if not sooner.
This is the smoking gun:
THE HUMAN INFLUENCE ON CLIMATE CHANGE IS SO STRONG WE ARE MAKING THE PLANET RAPIDLY WARM IN A TIME WHEN IT SHOULD BE SLOWLY COOLING!!
This study
Climate variations analyzed five million years back in time
shows that the interglacial periods, like the one we are in now, are ALWAYS stable. So the rapid warming we see now in the OPPOSITE direction to the natural slow cooling trend, is very very unnatural. It got human fingerprints all over it.
4. THE SUN - AND INTERNAL VARIABILITY
3rd ROCK FROM THE SUN
In the 1820s Joseph Fourier calculated that an object the size of the Earth, and at its distance from the Sun, should be considerably colder than the planet actually is if warmed by only the effects of incoming solar radiation.
If the sun is such a key driver of the Earth’s climate, then why has the entire planet (air, oceans, land, and ice) warmed rapidly over the past 60 years while solar activity has declined?
If the warming were caused by a more active sun, then scientists would expect to see warmer temperatures in all layers of the atmosphere. Instead, they have observed a cooling in the upper atmosphere, and a warming at the surface and in the lower parts of the atmosphere.
That's because greenhouse gases are trapping heat in the lower atmosphere. A very clear human fingerprint.

This phenomenon can only be attributed to the insulating effect of increasing greenhouse gases.
Annual global temperature change (thin light red) with 11 year moving average of temperature (thick dark red). Temperature from NASA GISS. Annual Total Solar Irradiance (thin light blue) with 11 year moving average of TSI (thick dark blue). TSI from 1880 to 1978 from Krivova et al 2007 (data). TSI from 1979 to 2009 from PMOD.
Global warming isn’t natural, and here’s how we know

Both the timing and magnitude of today’s warming are well-explained by greenhouse gases.
This is why scientists conclude that humans are likely responsible for most of the warming of the last few decades. Greenhouse gases provide a reasonable explanation for the warming, while no other factor can explain the entire warming.
The signals are coming from the planet itself:
There are OBSERVED data from pollen, tree rings, ice cores, corals, glaciers withdrawal, polar ice melting, sea level rise, ocean temperature, ecological changes, Co2 levels in the atmosphere, the undeniable temperature increase globally.
Do you think there is a another explanation for global warming which just happen to have exactly the same characteristics as an increase of C02 and the other greenhouse gases?
The other factors can’t make all the check marks:

Internal variability is the hardest to evaluate. We know that ENSO significantly changes the Earth’s temperature, and so long-term ENSO-like variation is something we have to consider. However, nobody has yet put forth a viable mechanism or shown data that such a long-term cycle exists. In the absence of any evidence supporting it, we conclude that it’s likely internal variability is playing a minor role in today’s warming. Clearly, future research might cause us to re-examine this conclusion.
Human fingerprints on climate change rule out natural cycles
Natural cycles can only move heat around, as heat exchange within the oceans or from the oceans to the atmosphere. But now we see adding of heat both in oceans and the atmosphere. So the adding of heat to the energy budget we see now must come from somewhere else than natural cycles.

No credible study has suggested that ocean oscillations can account for the long-term trends. The key observation here is the increase in ocean heat content over the last half century (the figure below shows three estimates of the changes since 1955). This absolutely means that more energy has been coming into the system than leaving.
http://www.realclimate.org/index.php/archives/2017/04/judy-currys-attribution-non-argument/#comment-677575

Now this presents a real problem for claims that ocean variability is the main driver. To see why, note that ocean dynamics changes only move energy around – to warm somewhere, they have to cool somewhere else. So posit an initial dynamic change of ocean circulation that warms the surface (and cools below or in other regions). To bring more energy into the system, that surface warming would have to cause the top-of-the-atmosphere radiation balance to change positively, but that would add to warming, amplifying the initial perturbation and leading to a runaway instability. There are really good reasons to think this is unphysical.
Remember too that ocean heat content increases were a predicted consequence of GHG-driven warming well before the ocean data was clear enough to demonstrate it.
Arctic sea-ice decline weakens the Atlantic Meridional Overturning Circulation
https://www.nature.com/articles/nclimate3353?foxtrotcallback=true
Measurement of Oceanic Heat Flow
https://www.sciencedirect.com/science/article/pii/S0076695X08606006
Summary/Conclusion
All temperature data available, including ocean data and satellite data, shows the same warming of 1.1 C (2.0 F) since about 1880.
From the Berkeley Earth page:

Here is the best known, the GISS data from NASA:
GISS Surface Temperature Analysis (GISTEMP)
HERE ARE DATA FOR EUROPE:

Global and European temperature
Two long-term ocean-only temp series (with 95% conf. intervals) shows the same trend as weather stations and satellite data:
http://www.realclimate.org/index...

Isolated satellite data shows same trend as weather stations and ocean data:
RSS: This is from their home page:
http://images.remss.com/msu/msu_...

UAH SATELLITE DATA:
http://www.drroyspencer.com/late...

For a long time the UAH satellite data showed less warming than all the other data, but this was due to a bug in the system. When this calibration error was fixed, the data showed the same warming as the other data.
Satellite measurements of the troposphere confirm warming trend, data shows | Carbon Brief
Major correction to satellite data shows 140% faster warming since 1998
What trend do the UAH data show now? Lets go to the UAH home page:
The University of Alabama in Huntsville
https://www.nsstc.uah.edu/climat...
Their trend is 0.13 C per decade. Very much in tune with all the other data.

In the same period, NOAA data shows a trend of 0.10 C per decade!
Climate at a Glance

SATELLITE DATA ARE NOT MORE ACCURATE.
Satellites don't measure temperatures, they measure brightness.
Brightness is converted to temperatures via computer models.
The satellite record has 5 times the inaccuracy of the surface temperature record.
Satellites measure the brightness of the troposphere, thousands of feet in the air (where planes fly).
The surface temperature record measures the temperature at the surface, where people live.
EXPLAINED BY SENIOR SCIENTIST FOR RSS SATELLITE DATA, CARL MEARS.
https://youtu.be/8BnkI5vqr_0
Even a Koch-brothers funded study confirmed the temperature data:
https://www.theguardian.com/scie...
https://www.forbes.com/sites/ale...

What happens if we put the temperature data onto each other?
The 5 most known temp data, when compared, fits like hand in glove:
Explainer: how surface and satellite temperature records compare | Carbon Brief

Pick any nation of the world and check to see if their mets have a similar temperature trend to the global GISS temperature trend from NASA.
BONUS. THE “PAUSE” THAT NEVER WAS

The 1998 year was an super strong El Nino year and temperatures would always flat out a bit after that. One explanation for the recent "slowdown" in global warming is that a prolonged La Niña-like cooling of eastern Pacific surface waters has helped to offset the global rise in temperatures from greenhouse gases.
Roger Fjellstad Olsen's answer to Have climate deniers finally accepted that the 'pause' never happened? One never hears them mention it these days.
6 THE “HOCKEY STICK”
5 reasons why Michael E.Manns "hockeystick" is here to stay:

1. Its affirmed by US National Academy of Sciences (NAS)
https://www.nature.com/articles/4411032a.pdf?origin=ppub

They are one of the most respectable scientific academies and hold a very strong position world wide and in the US, all the way back since it was co-founded by Abraham Lincoln. As of 2016, the
National Academy of Sciences includes about 2,350 members and 450 foreign associates.
Approximately 200 members have won a Nobel Prize.
National Academy of Sciences - Wikipedia (National Academy of Sciences - Wikipedia)
Since then the “Hockey Stick” is confirmed and improved by the 4 most comprehensive studies done on the matter:
2. 78 researchers from 24 countries, together with many other colleagues, worked for seven years in the PAGES 2k project on the new climate reconstruction. “2k” stands for the last 2000 years, while PAGES stands for the Past Global Changes program launched in 1991. Recently, their new study was published in Nature Geoscience.
It is based on 511 climate archives from around the world, from sediments, ice cores, tree rings, corals, stalagmites, pollen or historical documents and measurements. All data are freely available.
Most Comprehensive Paleoclimate Reconstruction Confirms Hockey Stick (Most Comprehensive
Paleoclimate Reconstruction Confirms Hockey Stick)
Continental-scale temperature variability during the past two millennia (Continental-scale temperature variability during the past two millennia)
IPPC 2007:
Climate Change 2007 (AR4)

3. Planet Earth is warmer than it has been for at least 2,000 years, according to a study that took its temperature from 692 different “natural thermometers” on every continent and ocean on the planet.
The database gathers 692 records from 648 locations, including all continental regions and major ocean basins.
The records are from trees, ice, sediment, corals, speleothems, documentary evidence, and other archives. They range in length from 50 to 2000 years, with a median of 547 years, while temporal resolution ranges from biweekly to centennial.
The world is hotter than it has been for at least 2,000 years (The world is hotter than it has been for at least 2,000 years)
A global multiproxy database for temperature reconstructions of the Common Era (A global multiproxy database for temperature reconstructions of the Common Era)
IPPC 2013:
IPCC Fifth Assessment Report

4. Researchers reconstructed temperatures from fossil pollen collected from 642 lake or pond sites across North America -- including water bodies in Wyoming -- and Europe.[...]
The reconstructions indicate that evidence of periods that were significantly warmer than the last decade were limited to a few areas of the North Atlantic that were probably unusual globally. Shuman says results determined that the last decade was roughly 6.5 degrees Fahrenheit warmer today than it was 11,000 years ago. Additionally, the decade was at least one-half degree Fahrenheit warmer today than the warmest periods of that 11,000-year time frame, even counting for uncertainties, Shuman says.
(Most of last 11,000 years cooler than past decade in North America, Europe)
Reconciling divergent trends and millennial variations in Holocene temperatures
(Reconciling divergent trends and millennial variations in Holocene temperatures)
5. A Reconstruction of Regional and Global Temperature for the Past 11,300 Years
https://www2.bc.edu/jeremy-shakun/Marcott%20et%20al.,%202013,%20Science.pdf
BONUS:
The "hockeystick" data IS available here:
Michael E. Mann (Michael E. Mann)
7. CONSENSUS UPDATE:
The 97 % is old news. Why is it even higher now?
There are two main reasons for this:

Those 3% of scientific papers that deny climate change? A review found them all flawed
MORE AND MORE OIL COMPANIES AGREES ON AGW AND WORKS TO REDUCE GAS EMISSIONS.
Its over.
Climate change skeptics have outlived their usefulness to the fossil fuel industry.
Climate deniers are like those japanese soldiers who was unaware that the war had ended 60 years ago.
GCI is a voluntary, CEO-led initiative which aims to lead the industry response to climate change. Launched in 2014, OGCI is currently made up of ten oil and gas companies that pool expert knowledge and collaborate on action to reduce greenhouse gas emissions.

http://oilandgasclimateinitiative.com/
Every scientific body, org and institution of the world, every National Academy of Sciences of the world, over 99% of the peer reviewed papers + most oil companies ALL agree that AGW theory is a fact. And everything is supported by the principles of basic physics!

List of Worldwide Scientific Organizations
ON THE CONSENSUS:
The consensus did not arise from a vote or a gathering. It speaks to the evidence. Scientists come to a consensus after a convergence of evidence leaves no significant doubt about a result. It happens a lot in science. There is a consensus that the speed of light is the universe's speed limit. Scientists didn't vote on that or gather to agree and find evidence to support that agreement.
They came to a consensus after the research from multiple independent lines of evidence converged. The same process has taken place in climate science. Scientists didn't vote on the validity of AGW or come together and agree before the evidence came in. They came to a consensus based upon multiple independent lines of evidence converged to support AGW. The consensus among scientists is real, it is not based on popularity or voting, it is based on a convergence of multiple independent lines of scientific evidence.
“Science is never 100% settled - science is about narrowing uncertainty. Different areas of science are understood with varying degrees of certainty. For example, we have a lower understanding of the effect of aerosols while we have a high understanding of the warming effect of carbon dioxide. Poorly understood aspects of climate change do not change the fact that a great deal of climate science is well understood.”
Scientists are working on the details and are improving the knowledge database every day. New finding and corrections are happening on a daily basis. This is science at work, it doesn’t mean the main theory is wrong.
The scientific method does not produce, nor is meant to produce, absolute truths and knowledge, but increased knowledge. Such is the case - and so it must be - in climate research as for all other research. Major theories are generally always based on a large amount of smaller scientific findings. Because these little discoveries are made through the implementation of the scientific method, they makes the major scientific theories so robust and credible. In other words, there are infinite many filters, tests, corrections and objections until one gets a conclusion.
That humans contribute most to climate change with our C02 emissions is such a conclusion.
The opinion of any single individual scientist is irrelevant. Consensus matters in science. You will find individual scientist who dispute Einsteins Theory of General Relativity and that’s fine. That’s how science works, but the consensus holds until the evidence convinces otherwise.
Why Climate Skeptics Are Wrong
SUMMARY:
Professor Kerry Emanuel has been known for his "Show me the data!" approach to climate science. In this talk, he will present a long term, evidence-driven view of Earth's climate change, culminating in a discussion of current risks and implications.
Professor Emanuel is an award-winning meteorologist and climate scientist and the Cecil and Ida Green Professor of Atmospheric Science at MIT. His research focuses on tropical meteorology and climate, with a specialty in hurricane physics. Emanuel has a PhD from MIT, has been a faculty member since 1981 and has served as the Director of the Center for Meteorology and Physical Oceanography and the Program in Atmospheres, Oceans, and Climate. He is co-founder of the MIT Lorenz Center, which fosters creative approaches to fundamental science devoted to understanding how climate works. He was named one of Time Magazine's 100 Influential People who Shape Our World in 2006. In 2007, he was elected as a member of the U.S. National Academy of Sciences. He is an author of over 100 peer-reviewed scientific papers and two books, including What We Know about Climate Change, recently hailed by the NY Times as "... the single best thing written about climate change for a general audience."
8. A HISTORY LESSON - HOW LONG HAVE THERE BEEN CLIMATE SCIENCE?
Climate scientist Katharine Heyhoe:
THE GREENHOUSE EFFECT

1896:
Svante Arrhenius -We can
Using 'Stefan's law' (better known as the Stefan-Boltzmann law), he formulated what he referred to as a 'rule'.
While other planets in Earth's solar system are either scorching hot or bitterly cold, Earth's surface has relatively mild, stable temperatures. Earth enjoys these temperatures because of its atmosphere, which is the thin layer of gases that cloak and protect the planet.

Step 1: Solar radiation reaches the Earth's atmosphere - some of this is reflected back into space.
Step 2: The rest of the sun's energy is absorbed by the land and the oceans, heating the Earth.
Step 3: Heat radiates from Earth towards space.
Step 4: Some of this heat is trapped by greenhouse gases in the
atmosphere, keeping the Earth warm enough to sustain life.
Step 5: Human activities such as burning fossil fuels, agriculture and land clearing are increasing the amount of greenhouse gases released into the atmosphere.
Step 6: This is trapping extra heat, and causing the Earth's temperature to rise.
"the critical link between c02 concentrations and the addition of energy to the system, or the greenhouse effect [...] and further confirmation that the calculations used in today’s climate models are on track when it comes to representing the impact of CO2.
First Direct Observation of Carbon Dioxide’s Increasing Greenhouse Effect at the Earth’s Surface | Berkeley Lab
Observational determination of surface radiative forcing by CO2 from 2000 to 2010
Climate scientist Keah Schuenemann:
There are non condensable gases and there are water vapour which rains out.
“Without CO2 and the other non-condensing greenhouse gases ability to absorb infrared radiation, the terrestrial greenhouse would collapse and throw the global climate into an ice-bound state. Without the greenhouse gases in the atmosphere, the mean temperature of the Earth would be down to -15 degrees Celsius (4 F) instead of + 15 degrees Celsius (59F).”
We humans release 37 billion tonnes of CO2 every year. How can such a “small” amount be important? The point is this: How much % CO2 is of the already very tiny atmosphere is a comparison that does not mean that much. Only the greenhouse gases can capture heat radiation. The rest of the atmosphere contributes to just taking over heat from CO2, water vapor and co.
CO2 is "least" effective as greenhouse gas per kg, yet the gas's contribution to global warming is greatest because the amount released by humans is many times greater than the amount of other greenhouse gases. CO2 accounts for about 60% of the man-made consolidation of greenhouse effect today.
The non-condensing greenhouse gases CO2, ozone, N2O (nitrous oxide), CH4 (methane) and chlorofluorocarbons account for 25% of the total terrestrial greenhouse effect, thus serving the stable temperature structure that maintains today's levels of atmospheric water vapor and clouds via feedbacks that account for the remaining 75% of the greenhouse effect.
Fun facts. 750 billion tons of C02 moves through the carbon cycle each year, but C02, the gas which is the main driver for the temperature that made and makes Earth habitable, is only 0.04% of the atmosphere.
And the total mass of ozone in the atmosphere is about 3 billion metric tons. That may seem like a lot, but it is only 0.00006 percent of the atmosphere. Still, ozone protects life on Earth from the Sun’s ultraviolet (UV) radiation.
Roger Fjellstad Olsen's answer to Why do people believe CO2 emissions are a serious problem when they're now only a little over 400 parts per million of the atmosphere (0.04%)?
drivhuseffekten – Store norske leksikon
“If there had been no increase in the amounts of non-condensable greenhouse gases, the amount of water vapor in the atmosphere would not have changed with all other variables remaining the same. The addition of the non-condensable gases causes the temperature to increase and this leads to an increase in water vapor that further increases the temperature. This is an example of a positive feedback effect. The warming due to increasing non-condensable gases causes more water vapor to enter the atmosphere, which adds to the effect of the non-condensables.”
If that claim is true, then we should see that the amount of IR leaving the planet has decreased over time, and that decrease should match the increase in CO2. That is, of course, exactly what satellite data show (Harries et al. 2001; Griggs and Harries 2007). The IR leaving the earth since the 70s has decreased, and that decrease matches the increase in CO2. This is a direct test of anthropogenic climate change and cannot be explained by anything other than our CO2 trapping heat.
https://research-information.bristol.ac.uk/files/3006745/paper.pdf
https://journals.ametsoc.org/doi/full/10.1175/JCLI4204.1
9. THE WHO LAGS WHO EXPLAINED:
Its a false premise, because its both.
When the Earth comes out of an ice age, the warming is not initiated by CO2 but by changes in the Earth's orbit. The warming causes the oceans to release CO2. The CO2 amplifies the warming and mixes through the atmosphere, spreading warming throughout the planet. So CO2 causes warming AND rising temperature causes CO2 rise. Overall, about 90% of the global warming occurs after the CO2 increase.
The reason has to do with the fact that the warmings take about 5000 years to be complete. The lag is only 800 years. All that the lag shows is that CO2 did not cause the first 800 years of warming, out of the 5000 year trend.
The other 4200 years of warming could in fact have been caused by CO2, as far as we can tell from this ice core data.
What does the lag of CO2 behind temperature in ice cores tell us about global warming?

At least three careful ice core studies have shown that CO2 starts to rise about 800 years (600-1000 years) after Antarctic temperature during glacial terminations. These terminations are pronounced warming periods that mark the ends of the ice ages that happen every 100,000 years or so.
Shakun et al 2012 (above) found clear evidence of temperature lagging CO2 by obtaining data from a higher number and more diverse areas of the globe.

There are numerous feedback mechanisms involved in climate change. In other words, one event can trigger another event, which triggers another event, etc. In this case, what happened in the past was that a small amount of warming (usually regional) from factors other than CO2 (such as Milankovitch cycles) caused the oceans to warm up and release the CO2 stored in them (Martin et al. 2005; Toggweiler et al. 2006; Schmittner and Galbraith 2008; Skinner et al. 2010). Then, that increase in CO2 caused the majority of the warming (Shakun et al. 2012). So CO2 was actually the major driver of past climate changes (Lorius et al. 1990; Tripati et al. 2009; Shakun et al. 2012).
BONUS:

Frequently Asked Questions - Berkeley Earth
Midlatitude westerlies, atmospheric CO2, and climate change during the ice agessci-hub.bz
http://www.atmos.washington.edu/...
Global warming preceded by increasing carbon dioxide concentrations during the last deglaciation
Role of deep sea temperature in the carbon cycle during the last glacial
Midlatitude westerlies, atmospheric CO2, and climate change during the ice ages
Glacial greenhouse-gas fluctuations controlled by ocean circulation changes
https://courses.seas.harvard.edu...
High-resolution carbon dioxide concentration record 650,000–800,000 years before present
http://www.jerome-chappellaz.com...
CO2 lags temperature - what does it mean?
7. Is the current level of atmospheric CO2 concentration unprecedented in Earth’s history? Answer
10. LINKS:
[1] The Keeling Curve
[2] U.S. Greenhouse Gas Inventory Report: 1990-2014 | US EPA
[3] U.S. Climate Extremes Index (CEI): Introduction
[4] Global Carbon Project : Homepage
[5] 2016 was the hottest year on record
[6] Global Climate Report - Annual 2016
[7] Met Office Hadley Centre observations datasets
[8] U.S. Climate Extremes Index (CEI): Introduction
[9] Climate Change Indicators: U.S. and Global Temperature | US EPA
[10] National Snow and Ice Data Center
[11] West Antarctic ice sheet and CO2 greenhouse effect: a threat of disaster
[12] Current State of the Sea Ice Cover
[13] PIOMAS Arctic Sea Ice Volume Reanalysis
[14] https://www.atmos-chem-phys.net/...
[15] CU Sea Level Research Group
[16] Global Average Absolute Sea Level Change, 1880-2014
[17] Extended Reconstructed Sea Surface Temperature (ERSST) v4
[18] Sea Surface Temperature
[19] Climate Change Indicators: Sea Surface Temperature | US EPA
[20] The National Academies Press
https://rationalwiki.org/wiki/War_on_Science
https://rationalwiki.org/wiki/Science_was_wrong_before
For climate models and climate sensitivity, read my other answer:
Roger Fjellstad Olsen's answer to Why are the predictions made by mathematical models of complex systems above criticism or debate in Climate Change science only?
For C02s bad effect on plant life:
https://www.quora.com/share/How-soon-will-we-feel-the-effects-of-global-warming-and-how-will-it-influence-our-day-to-day-lives-1?ch=10&share=9dc5a44c
“According to natural factors, we should be cooling right now, not warming. So they can’t be responsible for our current warming trend.”
(Climate scientist Katharine Hayhoe.)
- The climate changes we have now are 20 times faster than the climate changes we had when leaving the last ice age. No natural changes can do this.
- The changes are in the OPPOSITE direction to the slow cooling trend we were on. The planet should still be cooling. But we are rapidly warming.
The moment when natural climate change became AGW! The huge blue spike to the right. It’s that obvious.
WE have changed the natural slow cooling trend. If it was “climate has always changed and natural cycles, BOTH C02 LEVELS AND TEMPERARURE SHOULD GO DOWN NOW!!
Nature does what it does. Extra carbon dioxide, extra greenhouse effect. Extra greenhouse effect, higher mean global temperature. Its basic physics which follows the same principles as other laws of nature.
The 10 Hottest Global Years on Record
For 400 Months in a Row, the Earth Has Been Warmer Than 20th Century Average
Last four years are 'world's hottest'
Some aspects of the science of AGW are known with near 100% certainty. The greenhouse effect itself is as established a phenomenon as any: it was discovered in the 1820s and the basic physics was essentially understood by the 1950s.
CONTENT
- The simple basic physics behind AGW
- What the peer reviewed science says
- Whats different with the climate change we have now?
- The Sun and internal variablity
- All temperature data shows the same warming trend
- The Hockey stick
- Consensus update
- The Greenhouse effect and a history lesson
- The who lags who “mystery” explained.
- Links
- CO2 happens to have a special feature naturally. It absorbs heat radiation very effectively. It has to do with the vibratory and rotational properties of the molecule itself. The structure of their molecules makes them especially effective at absorbing heat radiation while the major atmospheric gases, nitrogen and oxygen, are essentially transparent to it. We can easily measure their properties in laboratories, and derive them from quantum physics.
It’s so trivial 5th graders can demonstrate GHE at home:
John Tyndall's experiments also showed that molecules of water vapor, carbon dioxide, and ozone are the best absorbers of heat radiation, and that even in small quantities, these gases absorb much more strongly than the atmosphere itself.
Iain Stewart demonstrates a simple experiment that shows that carbon dioxide absorbs infrared radiation. Scene from BBC's 'Earth: The Climate Wars' documentary:
2. Anyone can take out their spectroscopes and see with their own eyes that C02 traps heat that would otherwise escape into space.
Spectroscopy is a method of detecting elements by looking at how electromagnetic radiation passes through them. Different elements have electrons in orbits at varying energy levels, and this affects the way they resonate. It's the reason why neon lights produce different colors depending on what gases we fill them with. It's also the way we're able to tell what proportions of hydrogen, helium, and other elements are in distant stars: the spectrum of light coming from them has peaks and valleys that are chemical fingerprints of exactly what gases are in them.
“The Earth's surface is warmed by the sun, and as a warm globe in space, the Earth itself emits that same heat right back out, as infrared radiation. If we go outside and point a spectrometer at the sky, we can see there are peaks and valleys in the infrared spectrum. Some wavelengths of heat fly right out into space unhindered, while other wavelengths are absorbed by the atmosphere, and that heat stays there, where we're able to detect its wavelength with our spectrometer. And exactly the same way as we're able to identify the elements in a distant star, we're able to identify exactly which greenhouse gases are trapping the Earth's radiative heat. This is how we were able to identify those five main gases. And this isn't new; we've understood this for 200 years. It's a direct measurement that anyone with a spectrometer can reproduce. Not a model, not a prediction, not a guess.”
“Water vapor, which is the most prominent, defines the basic shape of the greenhouse spectrum. Most of the infrared radiation that escapes the Earth goes through a window left open by water vapor, which we call the infrared window. This window in the spectrum, which is pretty wide, is centered around a wavelength of about 10 µm (micrometers). At higher and lower wavelengths, water vapor absorbs much of the Earth's radiated heat, so the Earth has always relied on this open window in the spectrum to allow the excess heat to escape. One end of the infrared window is overlapped by CO2's absorption range, which is centered around 15 µm. The amount of CO2 in the atmosphere acts like a sliding door which widens or narrows the infrared window. As CO2 increases, the infrared window is narrowed, less radiation escapes into space, and more heat is absorbed by the atmosphere. At the other end of the infrared window, around 7.5 µm, methane has a similar effect, contributing about 1/4 as much warming as CO2.”
“Spectroscopy is hard science. We don't have to model or predict. Simply by pointing our instruments at the sky, we can, right now, directly observe and identify the greenhouse gases, and measure exactly how much radiative energy the atmosphere is absorbing and keeping here on Earth. This direct, non-ambiguous spectroscopic reading is the "smoking gun" that proves the excess heat energy being trapped in our atmosphere is due to CO2.”
[…] “Within that infrared window defined by water vapor, there is one big spike. It is the 15 µm range of CO2. This is explicit, unambiguous proof that the increased heat in our atmosphere is due to CO2. It has nothing to do with models or predictions; it is a direct observation, it is hard chemistry and basic physics, not guesswork or extrapolation.”
“As we burn fossil fuels, the CO2 in the atmosphere increases, the infrared window narrows, less heat radiates away from the Earth, and more heat goes into the Earth's system. These are simple, solid facts.Energy being trapped in the atmosphere corresponds exactly to the wavelengths of energy captured by CO2.”
https://ams.confex.com/ams/pdfpapers/100737.pdf
The Simple Proof of Man-Made Global Warming
3. HOW DO WE KNOW ITS OUR CO2 CAUSING THE WARMING?
The carbon in the atmospheric CO2 contains information about its source, so that scientists can tell that fossil fuel emissions comprise the largest source of the increase since the pre-industrial era.
How do we know that recent CO2 increases are due to human activities?
Global warming isn’t natural, and here’s how we know
The carbon from burning fossil fuels have a different isotope signal (radioactivity) than C02 coming from natural sources. Its like a fingerprint. Its the carbons "DNA". Its unique.
Here’s how scientists know.
“We can carbon date the CO2 in the atmosphere, and tell exactly how much of it comes from humans burning fossil fuels. It's a direct measurement. It leaves no room for interpretation”.
“The same elements (i.e. same number of protons in the nucleus) with different mass numbers (arising from the different numbers of neutrons in the nucleus) are called isotopes. Each carbon molecule has six protons in the nucleus, but there are many different isotopes with varying numbers of neutrons in the nucleus. Carbon isotopes from different sources are “lighter” (high negative value) or heavier (lower negative value). For example, carbon from ocean is the standard with a value of “0” while carbon from fossil fuels ranges from -20 to -32. While atmospheric carbon has an average value of -5 to -9, it is becoming “lighter” over time as carbon from fossil fuels become more abundant in the atmosphere.”
The Suess Effect is a term which has come to signify the decrease in 14C in atmospheric CO2 owing to admixture of CO2 produced by the combustion of fossil fuels. This term is here extended, as a concept, to the shifts in isotopic ratio of both 13C and 14C in any reservoir of the carbon cycle owing to anthropogenic activities.
The Suess effect: 13Carbon-14Carbon interrelations
Changes in the 13C/12C ratio of atmospheric CO2 are also caused by other sources and sinks, but the changing isotopic signal due to CO2 from fossil fuel combustion can be resolved from the other components (Francey et al., 1995).
http://bluemoon.ucsd.edu/publications/ralph/25_Partition.pdf
Additional confirmation that rising CO2 levels are due to human activity comes from examining the ratio of carbon isotopes found in the atmosphere. Carbon 12 has 6 neutrons, carbon 13 has 7 neutrons. Plants have a lower C13/C12 ratio than in the atmosphere. If rising atmospheric CO2 comes from fossil fuels, the C13/C12 should be falling. Indeed this is what is occurring (Ghosh 2003). The C13/C12 ratio correlates with the trend in global emissions.
http://www.bgc.mpg.de/service/iso_gas_lab/publications/PG_WB_IJMS.pdf
Orbiting Carbon Observatory-2 (OCO-2): NASA's New Carbon Counter
2. WHAT THE BEST PEER REVIEWED SCIENCE SAYS:
From about 1880 our C02 emissions started to dominate CC , and after 1950, according to scientists, humans ARE the dominant cause of CC.
Fourth National Climate Assessment (NCA4), Volume I peer reviewed by the National Academy of Sciences, the world’s most prestigious academy, founded by Abraham Lincoln, with over 200 Nobel Price winners among their members.
This report is an authoritative assessment of the science of climate change, with a focus on the United States. It represents the first of two volumes of the Fourth National Climate Assessment, mandated by the Global Change Research Act of 1990.
The 600 page report was created from input by scientists working at 13 different federal government agencies.
“Based on extensive evidence … it is extremely likely that human activities, especially emissions of greenhouse gases, are the dominant cause of the observed warming since the mid-20th century,”For the warming over the last century,
“there is no convincing alternative explanation supported by the extent of the observational evidence.”Climate Science Special Report: Executive Summary
Fourth National Climate Assessment: Executive Summary
IPCC:
“Anthropogenic greenhouse gas emissions have increased since the pre-industrial era, driven largely by economic and population growth, and are now higher than ever. This has led to atmospheric concentrations of carbon dioxide, methane and nitrous oxide that are unprecedented in at least the last 800,000 years. Their effects, together with those of other anthropogenic drivers, have been detected throughout the climate system and are extremely likely to have been the dominant cause of the observed warming since the mid-20th century. {1.2, 1.3.1}”.
https://www.ipcc.ch/pdf/assessment-report/ar5/syr/AR5_SYR_FINAL_SPM.pdf
Global warming: why is IPCC report so certain about the influence of humans? | Dana Nuccitelli
https://www.ipcc.ch/pdf/assessment-report/ar4/wg1/ar4-wg1-chapter2.pdf
NASA:
The evidence for rapid climate change is compelling:
The planet's average surface temperature has risen about 1.62 degrees Fahrenheit (0.9 degrees Celsius) since the late 19th century, a change driven largely by increased carbon dioxide and other human-made emissions into the atmosphere.
Most of the warming occurred in the past 35 years, with the five warmest years on record taking place since 2010. Not only was 2016 the warmest year on record, but eight of the 12 months that make up the year — from January through September, with the exception of June — were the warmest on record for those respective months.
Climate change evidence: How do we know?
COPERNICUS:
Average temperatures for 2017 were higher than climatological values for 1981-2010 over virtually all of Europe.
Climate in 2017 - European temperature
OBSERVATIONS:
First Direct Observation of Carbon Dioxide’s Increasing Greenhouse Effect at the Earth’s Surface
"the critical link between c02 concentrations and the addition of energy to the system, or the greenhouse effect [...] and further confirmation that the calculations used in today’s climate models are on track when it comes to representing the impact of CO2.”
Observational determination of surface radiative forcing by CO2 from 2000 to 2010
Studies: atmospheric CO2 concentration drives climate change
On the causal structure between CO2 and global temperature
Studies: atmospheric CO2 drives climate change ancient and modern.
99.999% certainty humans are driving global warming: new study
ScienceDirect
CO₂ and other Greenhouse Gas Emissions
https://www.c2es.org/facts-figures/international-emissions/historical
https://www.ipcc.ch/pdf/assessment-report/ar5/syr/SYR_AR5_FINAL_full_wcover.pdf
The Keeling Curve
Rising Global Temperatures and CO2
https://stephenschneider.stanford.edu/Publications/PDF_Papers/shaviv-veizer-03.pdf
3. Whats different with the climate change we have now?
1 degree C warming, in only a hundred years, is twenty times faster than the climate changes the Earth experienced when it thawed after the last ice age, and in the OPPOSITE direction to the natural slow cooling trend we were supposed to be on, and in the OPPOSITE direction to the natural slow cooling trend we were supposed to be on. The increase of atmosphere C02 from 280 ppm in 1880 to 407 ppm we have today, would normally take thousands of years. Its the highest C02 ppm for millions of years.
407 - 280 = 127
( 127 / 280 ) * 100 = 45.36 %
45% of the C02 up there is ours now..
We see very rapid warming, in the OPPOSITE direction of the natural slow cooling trend. The increase is happening at a time when, naturally, carbon dioxide levels and temperature should be decreasing.
THE RAPID INCREASE IN C02 SINCE THE POST INDUSTRIAL ERA WOULD NATURALLY TAKE THOUSANDS OF YEARS
For the 800,000 years we have records of, average global CO2 levels fluctuated between about 170 ppm and 280 ppm. Once humans started to burn fossil fuels in the industrial era, things changed rapidly.
Only in the industrial era has the number risen above 300 ppm. The concentration first crept above 400 ppm in 2013, and continues to climb.
Look at the spike and dramatic change of pattern to the right. Thats because of us.
Climate change evidence: How do we know?
Scientists debate the last time CO2 levels were this high. It might have happened during the Pliocene era, between 2 and 4.6 million years ago, when sea levels were at least 60 to 80 feet higher than today. It may have been in the Miocene, 10 to 14 million years ago, when seas were more than 100 feet higher than now.
In our 800,000-year record, it took about 1,000 years for CO2 levels to increase by 35 ppm. We're currently averaging an increase of more than 2 ppm per year, meaning that we could hit an average of 500 ppm within the next 45 years, if not sooner.
This is the smoking gun:
THE HUMAN INFLUENCE ON CLIMATE CHANGE IS SO STRONG WE ARE MAKING THE PLANET RAPIDLY WARM IN A TIME WHEN IT SHOULD BE SLOWLY COOLING!!
This study
Climate variations analyzed five million years back in time
shows that the interglacial periods, like the one we are in now, are ALWAYS stable. So the rapid warming we see now in the OPPOSITE direction to the natural slow cooling trend, is very very unnatural. It got human fingerprints all over it.
4. THE SUN - AND INTERNAL VARIABILITY
3rd ROCK FROM THE SUN
In the 1820s Joseph Fourier calculated that an object the size of the Earth, and at its distance from the Sun, should be considerably colder than the planet actually is if warmed by only the effects of incoming solar radiation.
If the sun is such a key driver of the Earth’s climate, then why has the entire planet (air, oceans, land, and ice) warmed rapidly over the past 60 years while solar activity has declined?
If the warming were caused by a more active sun, then scientists would expect to see warmer temperatures in all layers of the atmosphere. Instead, they have observed a cooling in the upper atmosphere, and a warming at the surface and in the lower parts of the atmosphere.
That's because greenhouse gases are trapping heat in the lower atmosphere. A very clear human fingerprint.
Lower troposphere temperatures are increasing:

Annual global temperature change (thin light red) with 11 year moving average of temperature (thick dark red). Temperature from NASA GISS. Annual Total Solar Irradiance (thin light blue) with 11 year moving average of TSI (thick dark blue). TSI from 1880 to 1978 from Krivova et al 2007 (data). TSI from 1979 to 2009 from PMOD.
"According to PMOD at the World Radiation Center there has been no increase in solar irradiance since at least 1978, when satellite observations began. This means that for the last thirty years, while the temperature has been rising fastest, the sun has not changed.”Not Much Warming Under the Sun
"Don't blame the sun for recent global warming. A new analysis, based on historical data rather than computer simulations, shows that our star's role in climate change has been vastly overtaken by other factors, particularly the human-induced buildup of greenhouse gases."
Global warming isn’t natural, and here’s how we know
Both the timing and magnitude of today’s warming are well-explained by greenhouse gases.
This is why scientists conclude that humans are likely responsible for most of the warming of the last few decades. Greenhouse gases provide a reasonable explanation for the warming, while no other factor can explain the entire warming.
The signals are coming from the planet itself:
There are OBSERVED data from pollen, tree rings, ice cores, corals, glaciers withdrawal, polar ice melting, sea level rise, ocean temperature, ecological changes, Co2 levels in the atmosphere, the undeniable temperature increase globally.
Do you think there is a another explanation for global warming which just happen to have exactly the same characteristics as an increase of C02 and the other greenhouse gases?
The other factors can’t make all the check marks:
Internal variability is the hardest to evaluate. We know that ENSO significantly changes the Earth’s temperature, and so long-term ENSO-like variation is something we have to consider. However, nobody has yet put forth a viable mechanism or shown data that such a long-term cycle exists. In the absence of any evidence supporting it, we conclude that it’s likely internal variability is playing a minor role in today’s warming. Clearly, future research might cause us to re-examine this conclusion.
"it's just a natural cycle" isn't just a cop-out argument - it's something that scientists have considered, studied, and ruled out long before you and I even knew what global warming was.
Human fingerprints on climate change rule out natural cycles
Natural cycles can only move heat around, as heat exchange within the oceans or from the oceans to the atmosphere. But now we see adding of heat both in oceans and the atmosphere. So the adding of heat to the energy budget we see now must come from somewhere else than natural cycles.
No credible study has suggested that ocean oscillations can account for the long-term trends. The key observation here is the increase in ocean heat content over the last half century (the figure below shows three estimates of the changes since 1955). This absolutely means that more energy has been coming into the system than leaving.
http://www.realclimate.org/index.php/archives/2017/04/judy-currys-attribution-non-argument/#comment-677575
Now this presents a real problem for claims that ocean variability is the main driver. To see why, note that ocean dynamics changes only move energy around – to warm somewhere, they have to cool somewhere else. So posit an initial dynamic change of ocean circulation that warms the surface (and cools below or in other regions). To bring more energy into the system, that surface warming would have to cause the top-of-the-atmosphere radiation balance to change positively, but that would add to warming, amplifying the initial perturbation and leading to a runaway instability. There are really good reasons to think this is unphysical.
Remember too that ocean heat content increases were a predicted consequence of GHG-driven warming well before the ocean data was clear enough to demonstrate it.
Arctic sea-ice decline weakens the Atlantic Meridional Overturning Circulation
https://www.nature.com/articles/nclimate3353?foxtrotcallback=true
Measurement of Oceanic Heat Flow
https://www.sciencedirect.com/science/article/pii/S0076695X08606006
Summary/Conclusion
- We know that it’s not the sun
- We know that it’s not Milankovitch cycles
- We know that it’s not volcanoes
- We know that even when combined, natural causes cannot explain the current warming
- We know that CO2 traps heat
- We know that increasing CO2 causes more heat to be trapped
- We know that CO2 was largely responsible for past climate changes
- We know that we have roughly doubled the CO2 in the atmosphere
- We know that the earth is trapping more heat now than it used to
- We know that including anthropogenic greenhouse gasses in the models is the only way to explain the current warming trend
All temperature data available, including ocean data and satellite data, shows the same warming of 1.1 C (2.0 F) since about 1880.
From the Berkeley Earth page:
Berkeley Earth has examined 16 million monthly average temperature observations from 43,000 weather stations...The weather station data is combined with sea surface temperature data from the UK Met Office’s Hadley Centre (HadSST). This ocean data is based on 355 million measurements collected by ships and buoys, including 12 million observations obtained in 2017.
Here is the best known, the GISS data from NASA:
GISS Surface Temperature Analysis (GISTEMP)
HERE ARE DATA FOR EUROPE:
Global and European temperature
Two long-term ocean-only temp series (with 95% conf. intervals) shows the same trend as weather stations and satellite data:
http://www.realclimate.org/index...
Isolated satellite data shows same trend as weather stations and ocean data:
RSS: This is from their home page:
http://images.remss.com/msu/msu_...
UAH SATELLITE DATA:
http://www.drroyspencer.com/late...
For a long time the UAH satellite data showed less warming than all the other data, but this was due to a bug in the system. When this calibration error was fixed, the data showed the same warming as the other data.
Satellite measurements of the troposphere confirm warming trend, data shows | Carbon Brief
Major correction to satellite data shows 140% faster warming since 1998
What trend do the UAH data show now? Lets go to the UAH home page:
The University of Alabama in Huntsville
https://www.nsstc.uah.edu/climat...
Their trend is 0.13 C per decade. Very much in tune with all the other data.
In the same period, NOAA data shows a trend of 0.10 C per decade!
Climate at a Glance
SATELLITE DATA ARE NOT MORE ACCURATE.
Satellites don't measure temperatures, they measure brightness.
Brightness is converted to temperatures via computer models.
The satellite record has 5 times the inaccuracy of the surface temperature record.
Satellites measure the brightness of the troposphere, thousands of feet in the air (where planes fly).
The surface temperature record measures the temperature at the surface, where people live.
EXPLAINED BY SENIOR SCIENTIST FOR RSS SATELLITE DATA, CARL MEARS.
https://youtu.be/8BnkI5vqr_0
Even a Koch-brothers funded study confirmed the temperature data:
https://www.theguardian.com/scie...
https://www.forbes.com/sites/ale...
What happens if we put the temperature data onto each other?
The 5 most known temp data, when compared, fits like hand in glove:
Explainer: how surface and satellite temperature records compare | Carbon Brief
Pick any nation of the world and check to see if their mets have a similar temperature trend to the global GISS temperature trend from NASA.
BONUS. THE “PAUSE” THAT NEVER WAS
The 1998 year was an super strong El Nino year and temperatures would always flat out a bit after that. One explanation for the recent "slowdown" in global warming is that a prolonged La Niña-like cooling of eastern Pacific surface waters has helped to offset the global rise in temperatures from greenhouse gases.
Roger Fjellstad Olsen's answer to Have climate deniers finally accepted that the 'pause' never happened? One never hears them mention it these days.
6 THE “HOCKEY STICK”
5 reasons why Michael E.Manns "hockeystick" is here to stay:
1. Its affirmed by US National Academy of Sciences (NAS)
https://www.nature.com/articles/4411032a.pdf?origin=ppub
They are one of the most respectable scientific academies and hold a very strong position world wide and in the US, all the way back since it was co-founded by Abraham Lincoln. As of 2016, the
National Academy of Sciences includes about 2,350 members and 450 foreign associates.
Approximately 200 members have won a Nobel Prize.
National Academy of Sciences - Wikipedia (National Academy of Sciences - Wikipedia)
Since then the “Hockey Stick” is confirmed and improved by the 4 most comprehensive studies done on the matter:
2. 78 researchers from 24 countries, together with many other colleagues, worked for seven years in the PAGES 2k project on the new climate reconstruction. “2k” stands for the last 2000 years, while PAGES stands for the Past Global Changes program launched in 1991. Recently, their new study was published in Nature Geoscience.
It is based on 511 climate archives from around the world, from sediments, ice cores, tree rings, corals, stalagmites, pollen or historical documents and measurements. All data are freely available.
Most Comprehensive Paleoclimate Reconstruction Confirms Hockey Stick (Most Comprehensive
Paleoclimate Reconstruction Confirms Hockey Stick)
Continental-scale temperature variability during the past two millennia (Continental-scale temperature variability during the past two millennia)
IPPC 2007:
Climate Change 2007 (AR4)
3. Planet Earth is warmer than it has been for at least 2,000 years, according to a study that took its temperature from 692 different “natural thermometers” on every continent and ocean on the planet.
The database gathers 692 records from 648 locations, including all continental regions and major ocean basins.
The records are from trees, ice, sediment, corals, speleothems, documentary evidence, and other archives. They range in length from 50 to 2000 years, with a median of 547 years, while temporal resolution ranges from biweekly to centennial.
The world is hotter than it has been for at least 2,000 years (The world is hotter than it has been for at least 2,000 years)
A global multiproxy database for temperature reconstructions of the Common Era (A global multiproxy database for temperature reconstructions of the Common Era)
IPPC 2013:
IPCC Fifth Assessment Report
4. Researchers reconstructed temperatures from fossil pollen collected from 642 lake or pond sites across North America -- including water bodies in Wyoming -- and Europe.[...]
The reconstructions indicate that evidence of periods that were significantly warmer than the last decade were limited to a few areas of the North Atlantic that were probably unusual globally. Shuman says results determined that the last decade was roughly 6.5 degrees Fahrenheit warmer today than it was 11,000 years ago. Additionally, the decade was at least one-half degree Fahrenheit warmer today than the warmest periods of that 11,000-year time frame, even counting for uncertainties, Shuman says.
(Most of last 11,000 years cooler than past decade in North America, Europe)
Reconciling divergent trends and millennial variations in Holocene temperatures
(Reconciling divergent trends and millennial variations in Holocene temperatures)
5. A Reconstruction of Regional and Global Temperature for the Past 11,300 Years
https://www2.bc.edu/jeremy-shakun/Marcott%20et%20al.,%202013,%20Science.pdf
BONUS:
The "hockeystick" data IS available here:
Michael E. Mann (Michael E. Mann)
7. CONSENSUS UPDATE:
The 97 % is old news. Why is it even higher now?
There are two main reasons for this:
Those 3% of scientific papers that deny climate change? A review found them all flawed
“If any of the contrarians were a modern-day Galileo, he would present a theory that’s supported by the scientific evidence and that’s not based on methodological errors.Why Climate Skeptics Are Wrong
MORE AND MORE OIL COMPANIES AGREES ON AGW AND WORKS TO REDUCE GAS EMISSIONS.
Its over.
Climate change skeptics have outlived their usefulness to the fossil fuel industry.
Climate deniers are like those japanese soldiers who was unaware that the war had ended 60 years ago.
GCI is a voluntary, CEO-led initiative which aims to lead the industry response to climate change. Launched in 2014, OGCI is currently made up of ten oil and gas companies that pool expert knowledge and collaborate on action to reduce greenhouse gas emissions.
http://oilandgasclimateinitiative.com/
Every scientific body, org and institution of the world, every National Academy of Sciences of the world, over 99% of the peer reviewed papers + most oil companies ALL agree that AGW theory is a fact. And everything is supported by the principles of basic physics!
List of Worldwide Scientific Organizations
ON THE CONSENSUS:
The consensus did not arise from a vote or a gathering. It speaks to the evidence. Scientists come to a consensus after a convergence of evidence leaves no significant doubt about a result. It happens a lot in science. There is a consensus that the speed of light is the universe's speed limit. Scientists didn't vote on that or gather to agree and find evidence to support that agreement.
They came to a consensus after the research from multiple independent lines of evidence converged. The same process has taken place in climate science. Scientists didn't vote on the validity of AGW or come together and agree before the evidence came in. They came to a consensus based upon multiple independent lines of evidence converged to support AGW. The consensus among scientists is real, it is not based on popularity or voting, it is based on a convergence of multiple independent lines of scientific evidence.
“Science is never 100% settled - science is about narrowing uncertainty. Different areas of science are understood with varying degrees of certainty. For example, we have a lower understanding of the effect of aerosols while we have a high understanding of the warming effect of carbon dioxide. Poorly understood aspects of climate change do not change the fact that a great deal of climate science is well understood.”
Scientists are working on the details and are improving the knowledge database every day. New finding and corrections are happening on a daily basis. This is science at work, it doesn’t mean the main theory is wrong.
The scientific method does not produce, nor is meant to produce, absolute truths and knowledge, but increased knowledge. Such is the case - and so it must be - in climate research as for all other research. Major theories are generally always based on a large amount of smaller scientific findings. Because these little discoveries are made through the implementation of the scientific method, they makes the major scientific theories so robust and credible. In other words, there are infinite many filters, tests, corrections and objections until one gets a conclusion.
That humans contribute most to climate change with our C02 emissions is such a conclusion.
The opinion of any single individual scientist is irrelevant. Consensus matters in science. You will find individual scientist who dispute Einsteins Theory of General Relativity and that’s fine. That’s how science works, but the consensus holds until the evidence convinces otherwise.
“Skeptics often claim that the science of anthropogenic global warming (AGW) is not “settled”. But to the extent that this statement is true it is trivial, and to the extent that it is important it is false. No science is ever “settled”; science deals in probabilities, not certainties. When the probability of something approaches 100%, then we can regard the science, colloquially, as “settled”.
The theory of gravity is not “settled” either, but it will be regarded as settled until we see apples falling upwards.
The skeptics say that results must be double-checked and uncertainties must be narrowed before any action should be taken. This sounds reasonable enough – but by the time scientific results are offered up to policymakers, they have already been checked and double-checked and quintuple-checked.
There is no cohesive, consistent alternative theory to human-caused global warming, Some blame global warming on the sun, others on orbital cycles of other planets, others on ocean cycles, and so on. There is a 97% expert consensus on a cohesive theory that's overwhelmingly supported by the scientific evidence, but the 2–3% of papers that reject that consensus are all over the map, even contradicting each other. The one thing they seem to have in common is methodological flaws like cherry picking, curve fitting, ignoring inconvenient data, and disregarding known physics.”
“For AGW skeptics to overturn the consensus, they would need to find flaws with all the lines of supportive evidence and show a consistent convergence of evidence toward a different theory that explains the data. (Creationists have the same problem overturning evolutionary theory.) This they have not done.”
Why Climate Skeptics Are Wrong
SUMMARY:
Professor Kerry Emanuel has been known for his "Show me the data!" approach to climate science. In this talk, he will present a long term, evidence-driven view of Earth's climate change, culminating in a discussion of current risks and implications.
Professor Emanuel is an award-winning meteorologist and climate scientist and the Cecil and Ida Green Professor of Atmospheric Science at MIT. His research focuses on tropical meteorology and climate, with a specialty in hurricane physics. Emanuel has a PhD from MIT, has been a faculty member since 1981 and has served as the Director of the Center for Meteorology and Physical Oceanography and the Program in Atmospheres, Oceans, and Climate. He is co-founder of the MIT Lorenz Center, which fosters creative approaches to fundamental science devoted to understanding how climate works. He was named one of Time Magazine's 100 Influential People who Shape Our World in 2006. In 2007, he was elected as a member of the U.S. National Academy of Sciences. He is an author of over 100 peer-reviewed scientific papers and two books, including What We Know about Climate Change, recently hailed by the NY Times as "... the single best thing written about climate change for a general audience."
8. A HISTORY LESSON - HOW LONG HAVE THERE BEEN CLIMATE SCIENCE?
Climate scientist Katharine Heyhoe:
THE GREENHOUSE EFFECT
In the 1820s Joseph Fourier calculated that an object the size of the Earth, and at its distance from the Sun, should be considerably colder than the planet actually is if warmed by only the effects of incoming solar radiation.
1859:
John Tyndall discovers that some gases block infrared radiation. He suggests that changes in the concentration of the gases could bring climate change.
Tyndall's experiments also showed that molecules of water vapor, carbon dioxide, and ozone are the best absorbers of heat radiation, and that even in small quantities, these gases absorb much more strongly than the atmosphere itself.
1896:
Svante Arrhenius -We can
"calculate estimates of the extent to which increases in atmospheric carbon dioxide increase Earth's surface temperature through the Arrhenius effect, leading David Keeling to conclude that human-caused carbon dioxide emissions are large enough to cause global warming"
Using 'Stefan's law' (better known as the Stefan-Boltzmann law), he formulated what he referred to as a 'rule'.
While other planets in Earth's solar system are either scorching hot or bitterly cold, Earth's surface has relatively mild, stable temperatures. Earth enjoys these temperatures because of its atmosphere, which is the thin layer of gases that cloak and protect the planet.
Step 1: Solar radiation reaches the Earth's atmosphere - some of this is reflected back into space.
Step 2: The rest of the sun's energy is absorbed by the land and the oceans, heating the Earth.
Step 3: Heat radiates from Earth towards space.
Step 4: Some of this heat is trapped by greenhouse gases in the
atmosphere, keeping the Earth warm enough to sustain life.
Step 5: Human activities such as burning fossil fuels, agriculture and land clearing are increasing the amount of greenhouse gases released into the atmosphere.
Step 6: This is trapping extra heat, and causing the Earth's temperature to rise.
"the critical link between c02 concentrations and the addition of energy to the system, or the greenhouse effect [...] and further confirmation that the calculations used in today’s climate models are on track when it comes to representing the impact of CO2.
First Direct Observation of Carbon Dioxide’s Increasing Greenhouse Effect at the Earth’s Surface | Berkeley Lab
Observational determination of surface radiative forcing by CO2 from 2000 to 2010
Climate scientist Keah Schuenemann:
There are non condensable gases and there are water vapour which rains out.
Water vapor doesn't accumulate, it rains out. What's accumulating, is CO2 and Methane. Water vapor *amplifies* the CO2 effect. But it doesn't accumulate like CO2 and Methane do. so it's not itself a driver of the changes we see. The amount of water vapor in the air is a function of temperature and pressure. As temperatures go up, the air will hold slightly more vapor, and that in turn traps more heat. The amount of vapor can be calculated using the Clausius-Clapeyron equations that are taught in 1st year physics.https://en.wikipedia.org/wiki/Cl...
“Without CO2 and the other non-condensing greenhouse gases ability to absorb infrared radiation, the terrestrial greenhouse would collapse and throw the global climate into an ice-bound state. Without the greenhouse gases in the atmosphere, the mean temperature of the Earth would be down to -15 degrees Celsius (4 F) instead of + 15 degrees Celsius (59F).”
We humans release 37 billion tonnes of CO2 every year. How can such a “small” amount be important? The point is this: How much % CO2 is of the already very tiny atmosphere is a comparison that does not mean that much. Only the greenhouse gases can capture heat radiation. The rest of the atmosphere contributes to just taking over heat from CO2, water vapor and co.
CO2 is "least" effective as greenhouse gas per kg, yet the gas's contribution to global warming is greatest because the amount released by humans is many times greater than the amount of other greenhouse gases. CO2 accounts for about 60% of the man-made consolidation of greenhouse effect today.
The non-condensing greenhouse gases CO2, ozone, N2O (nitrous oxide), CH4 (methane) and chlorofluorocarbons account for 25% of the total terrestrial greenhouse effect, thus serving the stable temperature structure that maintains today's levels of atmospheric water vapor and clouds via feedbacks that account for the remaining 75% of the greenhouse effect.
Fun facts. 750 billion tons of C02 moves through the carbon cycle each year, but C02, the gas which is the main driver for the temperature that made and makes Earth habitable, is only 0.04% of the atmosphere.
And the total mass of ozone in the atmosphere is about 3 billion metric tons. That may seem like a lot, but it is only 0.00006 percent of the atmosphere. Still, ozone protects life on Earth from the Sun’s ultraviolet (UV) radiation.
Roger Fjellstad Olsen's answer to Why do people believe CO2 emissions are a serious problem when they're now only a little over 400 parts per million of the atmosphere (0.04%)?
drivhuseffekten – Store norske leksikon
“If there had been no increase in the amounts of non-condensable greenhouse gases, the amount of water vapor in the atmosphere would not have changed with all other variables remaining the same. The addition of the non-condensable gases causes the temperature to increase and this leads to an increase in water vapor that further increases the temperature. This is an example of a positive feedback effect. The warming due to increasing non-condensable gases causes more water vapor to enter the atmosphere, which adds to the effect of the non-condensables.”
If that claim is true, then we should see that the amount of IR leaving the planet has decreased over time, and that decrease should match the increase in CO2. That is, of course, exactly what satellite data show (Harries et al. 2001; Griggs and Harries 2007). The IR leaving the earth since the 70s has decreased, and that decrease matches the increase in CO2. This is a direct test of anthropogenic climate change and cannot be explained by anything other than our CO2 trapping heat.
https://research-information.bristol.ac.uk/files/3006745/paper.pdf
https://journals.ametsoc.org/doi/full/10.1175/JCLI4204.1
“The earth’s climate is constrained by well-known and elementary physical principles, such as energy balance, flow, and conservation. Greenhouse gases affect the atmospheric optical depth for infrared radiation, and increased opacity implies higher altitude from which earth’s equivalent bulk heat loss takes place. Such an increase is seen in the reanalyses, and the outgoing long-wave radiation has become more diffuse over time, consistent with an increased influence of greenhouse gases on the vertical energy flow from the surface to the top of the atmosphere.”https://link.springer.com/article/10.1007%2Fs00704-016-1732-y
“We have shown that longwave downward radiation flux increases at Earth's surface can be accurately measured, subdivided and explicitly explained and backed with model calculations as cloud-, temperature-, water vapour- and enhanced greenhouse gas radiative forcing effect. Radiative forcing - measured at Earth's surface - corroborate the increasing greenhouse effect.”http://onlinelibrary.wiley.com/doi/10.1029/2003GL018765/full
“The changes of the outgoing longwave radiation (OLR) in clear-sky conditions have been calculated using High Resolution Infrared Radiation Sounder (HIRS) observations from 1979 to 2004.[...] The observed increase in GHE is shown to be inconsistent with the control ensemble, indicating that anthropogenic forcings are required to reproduce the observed changes in GHE. Satellite-Based Reconstruction of the Tropical Oceanic Clear-Sky Outgoing Longwave Radiation and Comparison with Climate Models.”http://journals.ametsoc.org/doi/abs/10.1175/JCLI-D-13-00047.1
9. THE WHO LAGS WHO EXPLAINED:
Its a false premise, because its both.
When the Earth comes out of an ice age, the warming is not initiated by CO2 but by changes in the Earth's orbit. The warming causes the oceans to release CO2. The CO2 amplifies the warming and mixes through the atmosphere, spreading warming throughout the planet. So CO2 causes warming AND rising temperature causes CO2 rise. Overall, about 90% of the global warming occurs after the CO2 increase.
The reason has to do with the fact that the warmings take about 5000 years to be complete. The lag is only 800 years. All that the lag shows is that CO2 did not cause the first 800 years of warming, out of the 5000 year trend.
The other 4200 years of warming could in fact have been caused by CO2, as far as we can tell from this ice core data.
What does the lag of CO2 behind temperature in ice cores tell us about global warming?
At least three careful ice core studies have shown that CO2 starts to rise about 800 years (600-1000 years) after Antarctic temperature during glacial terminations. These terminations are pronounced warming periods that mark the ends of the ice ages that happen every 100,000 years or so.
Shakun et al 2012 (above) found clear evidence of temperature lagging CO2 by obtaining data from a higher number and more diverse areas of the globe.
There are numerous feedback mechanisms involved in climate change. In other words, one event can trigger another event, which triggers another event, etc. In this case, what happened in the past was that a small amount of warming (usually regional) from factors other than CO2 (such as Milankovitch cycles) caused the oceans to warm up and release the CO2 stored in them (Martin et al. 2005; Toggweiler et al. 2006; Schmittner and Galbraith 2008; Skinner et al. 2010). Then, that increase in CO2 caused the majority of the warming (Shakun et al. 2012). So CO2 was actually the major driver of past climate changes (Lorius et al. 1990; Tripati et al. 2009; Shakun et al. 2012).
BONUS:
Frequently Asked Questions - Berkeley Earth
Midlatitude westerlies, atmospheric CO2, and climate change during the ice agessci-hub.bz
http://www.atmos.washington.edu/...
Global warming preceded by increasing carbon dioxide concentrations during the last deglaciation
Role of deep sea temperature in the carbon cycle during the last glacial
Midlatitude westerlies, atmospheric CO2, and climate change during the ice ages
Glacial greenhouse-gas fluctuations controlled by ocean circulation changes
https://courses.seas.harvard.edu...
High-resolution carbon dioxide concentration record 650,000–800,000 years before present
http://www.jerome-chappellaz.com...
CO2 lags temperature - what does it mean?
7. Is the current level of atmospheric CO2 concentration unprecedented in Earth’s history? Answer
10. LINKS:
[1] The Keeling Curve
[2] U.S. Greenhouse Gas Inventory Report: 1990-2014 | US EPA
[3] U.S. Climate Extremes Index (CEI): Introduction
[4] Global Carbon Project : Homepage
[5] 2016 was the hottest year on record
[6] Global Climate Report - Annual 2016
[7] Met Office Hadley Centre observations datasets
[8] U.S. Climate Extremes Index (CEI): Introduction
[9] Climate Change Indicators: U.S. and Global Temperature | US EPA
[10] National Snow and Ice Data Center
[11] West Antarctic ice sheet and CO2 greenhouse effect: a threat of disaster
[12] Current State of the Sea Ice Cover
[13] PIOMAS Arctic Sea Ice Volume Reanalysis
[14] https://www.atmos-chem-phys.net/...
[15] CU Sea Level Research Group
[16] Global Average Absolute Sea Level Change, 1880-2014
[17] Extended Reconstructed Sea Surface Temperature (ERSST) v4
[18] Sea Surface Temperature
[19] Climate Change Indicators: Sea Surface Temperature | US EPA
[20] The National Academies Press
https://rationalwiki.org/wiki/War_on_Science
https://rationalwiki.org/wiki/Science_was_wrong_before
For climate models and climate sensitivity, read my other answer:
Roger Fjellstad Olsen's answer to Why are the predictions made by mathematical models of complex systems above criticism or debate in Climate Change science only?
For C02s bad effect on plant life:
https://www.quora.com/share/How-soon-will-we-feel-the-effects-of-global-warming-and-how-will-it-influence-our-day-to-day-lives-1?ch=10&share=9dc5a44c


Ingen kommentarer:
Legg inn en kommentar