A number of attribution studies have been done to determine the human-caused component of the ongoing warming of our globe. What these studies found is that the positive forcing from human activities is the largest forcing, dwarfing all other combinedforcings (the sum of all natural forcings is actually negative; without the positive forcing from humans, the climate would actually be cooling).
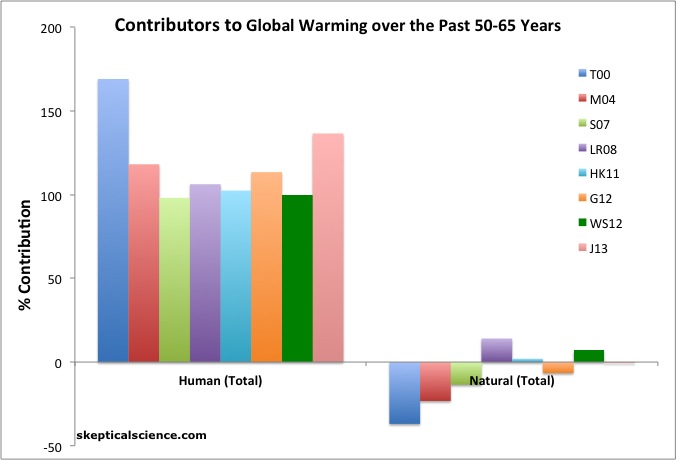
The contribution to global warming over the past 50-65 years is shown in two categories, human causes on the left and natural causes on the right, from various peer-reviewed studies (colors).
The studies used a wide range of independent methods, and provide multiple lines of evidence that humans are by far the dominant cause of recent global warming. Most studies showed that recent natural contributions have been in the cooling direction, thereby masking part of the human contribution and in some cases causing it to exceed 100% of the total warming. The two largest human influences are greenhouse gas (GHG) and sulfur dioxide (SO2) emissions, mostly from burning coal, oil, and natural gas (sulfur emissions tend to have a net cooling effect). The largest natural influences on the global temperature are the 11-year solar cycle, volcanic activity, and the El Nino Southern Oscillation (ENSO).
The studies are Tett et al. 2000 (T00, dark blue), Meehl et al. 2004 (M04, red), Stone et al. 2007 (S07, green), Lean and Rind 2008 (LR08, purple), Huber and Knutti 2011 (HK11, light blue), Gillett et al. 2012 (G12, orange), and Jones et al. 2013 (J13, pink). The numbers in this summary are best estimates from each study; uncertainty ranges can be found in the original research.
https://skepticalscience.com/a-comprehensive-review-of-the-causes-of-global-warming.html
http://articles.adsabs.harvard.edu/cgi-bin/nph-iarticle_query?2000ESASP.463..201T&data_type=PDF_HIGH&whole_paper=YES&type=PRINTER&filetype=.pdf
http://journals.ametsoc.org/doi/abs/10.1175/1520-0442%282004%29017%3C3721%3ACONAAF%3E2.0.CO%3B2
http://journals.ametsoc.org/doi/abs/10.1175/JCLI3966.1
http://citeseerx.ist.psu.edu/viewdoc/download?doi=10.1.1.167.2337&rep=rep1&type=pdf
http://www.ipcc.ch/report/graphics/images/Assessment%20Reports/AR5%20-%20WG1/SPM/FigSPM-05.jpg

More specifically, Huber and Knutti (2011) quantified that human attribution as being 74% and 122% due to humans (with a best estimate of around 100% human attribution). In other words, natural variability is not responsible for the observed warming trend.
http://www.nature.com/ngeo/journal/v5/n1/abs/ngeo1327.html?foxtrotcallback=true
Skeie et al (2011) found that, over the last 40+ years, the dominant forcing driving climate change/the current ongoing warming of the world is the radiative forcing from our fossil fuel usages.
https://www.atmos-chem-phys.net/.../acp-11-11827-2011.html
Since then, Gillett et al (2012) also examined the human attribution of the warming trend observed. They found that humans are responsible for 102% of observed warming from 1851 to 2010 and 113% of the observed warming from 1951 to 2000 and 1961 to 2010 (averaged together).
http://onlinelibrary.wiley.com/.../2011GL050226/abstract
Sedláček & Knutti (2012) examined ocean and atmosphere warming to ascertain whether recent global warming is consistent with natural variability, or with external forcing (i.e unrelated to internal variability of the climate system).
They found that both computer simulations and historical observations are incompatible with natural variability as a possible cause of ocean warming. I.e., natural factors/cycles are not the cause of the ongoing warming we can see and measure.
http://onlinelibrary.wiley.com/.../2012GL053262/abstract
Wigley and Santer (2012) examined the various forcings of climate and their impacts on global temperatures since 1900 using a new analysis of the uncertainty associated with the aerosol forcing. What they found was the IPCC has been far too conservative in attributing the observed global warming to human greenhouse gas emissions. In fact their central estimate is that humans are responsible for 100% of the observed global warming for the 1950–2005 timeframe, with greenhouse gases responsible for 160%.
In addition, without human influences on the climate, there would likely have been little change in the average global surface temperature over the past 50 years. Instead, surface temperatures have warmed approximately 0.65°C since 1960.
http://link.springer.com/article/10.1007%2Fs00382-012-1585-8
Compo et al (2013) confirmed global surface air warming without using the instrumental surface temperature record, meaning the warming is real, not just confounding factors like UHI.
http://onlinelibrary.wiley.com/.../10.../grl.50425/abstract
Imbers et al (2013) confirming that natural variability can't account for recent global warming, and that it's human-caused.
http://onlinelibrary.wiley.com/.../jgrd.50296/abstract
Jones et al (2013) concludes that greenhouse gases have caused between 100% and 200% of the observed global surface warming over the past 60 years, and other human influences (primarily aerosols) have offset a significant percentage of that warming via cooling effects. Natural temperature influences have had a very slight cooling effect, and natural internal variability appears to have had a fairly significant cooling effect over the past decade, but little temperature influence over longer timeframes.
The results of this study are consistent with the wide body of evidence supporting the settled science that human greenhouse gas emissions are the dominant cause of the current global warming.
http://onlinelibrary.wiley.com/.../jgrd.50239/abstract
Marvel and Bonfils (2013) establish that the changes in land and ocean precipitation predicted by theory are indeed present in the observational record, that these changes are unlikely to arise purely due to natural climate variability, and that external influences, probably anthropogenic in origin, are responsible.
http://www.pnas.org/content/early/2013/11/05/1314382110
Also, Risbey et al (2014) found that climate models actually generate good estimates of recent and past trends provided they also took into account natural variability, particularly the key El Nino-La Nina phases in the Pacific.
“You’re always going to get periods when the warming slows down or speeds up relative to the mean rate because we have these strong natural cycles,” Dr Risbey said.
In roughly 30-year cycles, the Pacific alternates between periods of more frequent El Ninos - when the ocean gives back heat to the atmosphere - to La Ninas, when it acts as a massive heat sink, setting in train relatively cool periods for surface temperatures.
By selecting climate models in phase with natural variability, the research found that climate models have provided good estimates of 15-year trends, including for recent periods and for Pacific spatial trend patterns.
http://www.nature.com/.../ncurrent/full/nclimate2310.html
And, the satellite-observed increase in upper-tropospheric water vapor over the last three decades is primarily attributable to human activities (Chung et al 2014).
"This attribution has significant implications for climate sciences because it corroborates the presence of the largest positive feedback in the climate system."
http://www.pnas.org/content/111/32/11636
Note that perturbations in atmospheric water vapor content equalize over a 9-day period, and that, as a condensable GHG, water vapor cannot act as a forcing to temperatures.
http://www.pnas.org/content/111/32/11636.abstract
https://en.wikipedia.org/wiki/Water_vapor#Water_vapor_in_Earth.27s_atmosphere
https://skepticalscience.com/water-vapor-greenhouse-gas-intermediate.htm
Lastly, global warming attribution studies consistently find humans are responsible for ALL the observed global warming over the past six decades.
https://www.theguardian.com/environment/climate-consensus-97-per-cent/2016/apr/19/study-humans-have-caused-all-the-global-warming-since-1950
https://link.springer.com/article/10.1007%2Fs00382-016-3079-6
The contribution to global warming over the past 50-65 years is shown in two categories, human causes on the left and natural causes on the right, from various peer-reviewed studies (colors).
The studies used a wide range of independent methods, and provide multiple lines of evidence that humans are by far the dominant cause of recent global warming. Most studies showed that recent natural contributions have been in the cooling direction, thereby masking part of the human contribution and in some cases causing it to exceed 100% of the total warming. The two largest human influences are greenhouse gas (GHG) and sulfur dioxide (SO2) emissions, mostly from burning coal, oil, and natural gas (sulfur emissions tend to have a net cooling effect). The largest natural influences on the global temperature are the 11-year solar cycle, volcanic activity, and the El Nino Southern Oscillation (ENSO).
The studies are Tett et al. 2000 (T00, dark blue), Meehl et al. 2004 (M04, red), Stone et al. 2007 (S07, green), Lean and Rind 2008 (LR08, purple), Huber and Knutti 2011 (HK11, light blue), Gillett et al. 2012 (G12, orange), and Jones et al. 2013 (J13, pink). The numbers in this summary are best estimates from each study; uncertainty ranges can be found in the original research.
https://skepticalscience.com/a-comprehensive-review-of-the-causes-of-global-warming.html
http://articles.adsabs.harvard.edu/cgi-bin/nph-iarticle_query?2000ESASP.463..201T&data_type=PDF_HIGH&whole_paper=YES&type=PRINTER&filetype=.pdf
http://journals.ametsoc.org/doi/abs/10.1175/1520-0442%282004%29017%3C3721%3ACONAAF%3E2.0.CO%3B2
http://journals.ametsoc.org/doi/abs/10.1175/JCLI3966.1
http://citeseerx.ist.psu.edu/viewdoc/download?doi=10.1.1.167.2337&rep=rep1&type=pdf
http://www.ipcc.ch/report/graphics/images/Assessment%20Reports/AR5%20-%20WG1/SPM/FigSPM-05.jpg
More specifically, Huber and Knutti (2011) quantified that human attribution as being 74% and 122% due to humans (with a best estimate of around 100% human attribution). In other words, natural variability is not responsible for the observed warming trend.
http://www.nature.com/ngeo/journal/v5/n1/abs/ngeo1327.html?foxtrotcallback=true
Skeie et al (2011) found that, over the last 40+ years, the dominant forcing driving climate change/the current ongoing warming of the world is the radiative forcing from our fossil fuel usages.
https://www.atmos-chem-phys.net/.../acp-11-11827-2011.html
Since then, Gillett et al (2012) also examined the human attribution of the warming trend observed. They found that humans are responsible for 102% of observed warming from 1851 to 2010 and 113% of the observed warming from 1951 to 2000 and 1961 to 2010 (averaged together).
http://onlinelibrary.wiley.com/.../2011GL050226/abstract
Sedláček & Knutti (2012) examined ocean and atmosphere warming to ascertain whether recent global warming is consistent with natural variability, or with external forcing (i.e unrelated to internal variability of the climate system).
They found that both computer simulations and historical observations are incompatible with natural variability as a possible cause of ocean warming. I.e., natural factors/cycles are not the cause of the ongoing warming we can see and measure.
http://onlinelibrary.wiley.com/.../2012GL053262/abstract
Wigley and Santer (2012) examined the various forcings of climate and their impacts on global temperatures since 1900 using a new analysis of the uncertainty associated with the aerosol forcing. What they found was the IPCC has been far too conservative in attributing the observed global warming to human greenhouse gas emissions. In fact their central estimate is that humans are responsible for 100% of the observed global warming for the 1950–2005 timeframe, with greenhouse gases responsible for 160%.
In addition, without human influences on the climate, there would likely have been little change in the average global surface temperature over the past 50 years. Instead, surface temperatures have warmed approximately 0.65°C since 1960.
http://link.springer.com/article/10.1007%2Fs00382-012-1585-8
Compo et al (2013) confirmed global surface air warming without using the instrumental surface temperature record, meaning the warming is real, not just confounding factors like UHI.
http://onlinelibrary.wiley.com/.../10.../grl.50425/abstract
Imbers et al (2013) confirming that natural variability can't account for recent global warming, and that it's human-caused.
http://onlinelibrary.wiley.com/.../jgrd.50296/abstract
Jones et al (2013) concludes that greenhouse gases have caused between 100% and 200% of the observed global surface warming over the past 60 years, and other human influences (primarily aerosols) have offset a significant percentage of that warming via cooling effects. Natural temperature influences have had a very slight cooling effect, and natural internal variability appears to have had a fairly significant cooling effect over the past decade, but little temperature influence over longer timeframes.
The results of this study are consistent with the wide body of evidence supporting the settled science that human greenhouse gas emissions are the dominant cause of the current global warming.
http://onlinelibrary.wiley.com/.../jgrd.50239/abstract
Marvel and Bonfils (2013) establish that the changes in land and ocean precipitation predicted by theory are indeed present in the observational record, that these changes are unlikely to arise purely due to natural climate variability, and that external influences, probably anthropogenic in origin, are responsible.
http://www.pnas.org/content/early/2013/11/05/1314382110
Also, Risbey et al (2014) found that climate models actually generate good estimates of recent and past trends provided they also took into account natural variability, particularly the key El Nino-La Nina phases in the Pacific.
“You’re always going to get periods when the warming slows down or speeds up relative to the mean rate because we have these strong natural cycles,” Dr Risbey said.
In roughly 30-year cycles, the Pacific alternates between periods of more frequent El Ninos - when the ocean gives back heat to the atmosphere - to La Ninas, when it acts as a massive heat sink, setting in train relatively cool periods for surface temperatures.
By selecting climate models in phase with natural variability, the research found that climate models have provided good estimates of 15-year trends, including for recent periods and for Pacific spatial trend patterns.
http://www.nature.com/.../ncurrent/full/nclimate2310.html
And, the satellite-observed increase in upper-tropospheric water vapor over the last three decades is primarily attributable to human activities (Chung et al 2014).
"This attribution has significant implications for climate sciences because it corroborates the presence of the largest positive feedback in the climate system."
http://www.pnas.org/content/111/32/11636
Note that perturbations in atmospheric water vapor content equalize over a 9-day period, and that, as a condensable GHG, water vapor cannot act as a forcing to temperatures.
http://www.pnas.org/content/111/32/11636.abstract
https://en.wikipedia.org/wiki/Water_vapor#Water_vapor_in_Earth.27s_atmosphere
https://skepticalscience.com/water-vapor-greenhouse-gas-intermediate.htm
Lastly, global warming attribution studies consistently find humans are responsible for ALL the observed global warming over the past six decades.
https://www.theguardian.com/environment/climate-consensus-97-per-cent/2016/apr/19/study-humans-have-caused-all-the-global-warming-since-1950
https://link.springer.com/article/10.1007%2Fs00382-016-3079-6


Ingen kommentarer:
Legg inn en kommentar