This blog uses the best up-to-date peer-reviewed climate science, quality sources, logic and critical thinking to explain man-made climate change and to debunk fake news, propaganda, myths and conspiracy theories.
Bloggen bruker den beste oppdaterte fagfellevurderte klimavitenskapen, kildekritikk og kritisk tenking til å forklare de menneskeskapte klimaendringene og til å svare på falske nyheter, propaganda, myter, konspirasjonsteorier og alternative virkelighetsoppfatninger om klima.
Jeg har da ikke feber, jeg fryser jo sånn! Even as climate warms, we will always have winter (cold weather, snowstorms, blizzards). Winter is related to how the Earth is tilted on its axis as it moves around the Sun.
Climate change is the long term trends, measured over decades or more, and those long term trends show that the globe is still warming.
"The difference between weather and climate is a measure of time. Weather is what conditions of the atmosphere are over a short period of time, and climate is how the atmosphere "behaves" over relatively long periods of time. When we talk about climate change, we talk about changes in long-term averages of daily weather"
Det er lett å blande sammen nylige værhendelser med langsiktige klimatrender, og det er vanskelig å forstå forskjellen mellom vær og klima.[...] For å finne klimatrender, så må man se på hvordan været endrer seg over et lengre tidsrom.
Gjennom å se på høye og lave temperaturer fra de siste tiår, så ser vi at nye varmerekorder inntreffer nesten dobbelt så ofte som nye kulderekorder. LES MER OM KALDE VINTRE OG GLOBAL OPPVARMING HER.
Climate sceptics often claim that recent icy winters show that global warming is not happening. New research suggests the opposite is true: As the ice melts it exposes open water which, being very much darker, absorbs more heat. The warmer water then warms the air above it which in turn, weakens the jet stream, the high level river of air which does much to determine the weather. As the jet stream slows down it meanders more, causing weather systems to get stuck in place with a “blocking pattern” that pulls cold, Arctic air down over Europe and northern Asia for long periods at a time. And, sure enough they say, recent cold winters have occurred in years when the amount of Arctic sea ice was especially low. ‘It’s too cold to snow’ — if it’s very cold, there is too little water vapor in the air to support a very heavy snowfall, and if it’s too warm, most of the precipitation will fall as rain.”[...] “Warmer air can contain more water vapor than cooler air. Global analyses show that the amount of water vapor in the atmosphere has in fact increased due to human-caused warming…. This extra moisture is available to storm systems, resulting in heavier rainfalls. Climate change also alters characteristics of the atmosphere that affect weather patterns and storms.”
Wet and dry extremes across the world will become more marked as the planet heats up, evidence from past climates shows.
The answer to the oft-asked question of whether an event is caused by climate change is that it is the wrong question. All weather events are affected by climate change because the environment in which they occur is warmer and moister than it used to be. Framing the way to relate climate extremes to climate change. Colder Winters Don't Mean Global Warming Isn't Happening
In recent decades, the Arctic has experienced more than its fair share of warming thanks to a phenomenon called Arctic amplification. A loss of sea ice, hotter ocean currents, and increased atmospheric water vapour mean temperatures have risen twice as fast around northern latitudes. These changes have also been associated with harsher winters much further south, a knock-on effect that often confuses people who assume global warming means we can all ditch our mittens. This new research has shown how above average temperatures in the Arctic lead to lower plant growth and decreased uptake of carbon dioxide in North American ecosystems. How Does Changing Climate Bring More Extreme Events?
The editors of a new book describe how and why weather and climate phenomena are intensifying with climate change.
Weather Patterns Are Getting Stuck as Climate Changes Affect the Jet Stream
Due to the nature of their work, climate scientists know more than the rest of us — but even they don't always agree about the ways in which climate change will affect weather in specific places. In 2012, a controversial study challenged previously accepted ideas about the mechanisms through which climate change will affect our weather: Warmer temperatures will result in more heat waves, hotter summers will bring worse droughts, the warmer atmosphere will hold more water, resulting in heavier precipitation and flooding. All of this might be true, but this study suggested that something else might be happening as well — that the relatively predictable flow of Earth's weather is changing. Due to alterations in the behavior of the jet stream, especially in the middle latitudes, weather patterns are getting "stuck" in place for longer periods, intensifying the on-the-ground effects, resulting in severe droughts, flooding and intense heat waves.
Polar Vortex: How the Jet Stream and Climate Change Bring on Cold Snaps
Global warming plays a role in blasts of bitter cold weather. The reason: It influences the jet stream. Eller som wikipedia forklarer : Den nordlige polare jetstrømmen ligger over de tett befolkede områdene i Europa, Nord-Amerika og Øst-Asia, og de viktige havene mellom disse verdensdelene. Lavtrykk med tilhørende nedbør og vind dannes ved polarfronten. Posisjonen til jetstrømmen er derfor avgjørende for været i disse områdene, og kunnskap om jetstrømmen er nødvendig for nøyaktig værvarsling. Avvik fra normal jetstrøm fører til uvanlige værsituasjoner. Sommeren 2007 lå jetstrømmen lenger sør enn vanlig. Dette førte til mye nedbør og store oversvømmelser i blant annet Storbritannia og Sør-Norge. Nord-Norge hadde derimot uvanlig varmt og tørt vær. Temperaturforskjellen driver jetstrømmen, og når forskjellen blir mindre kan jetstrømmen svekkes og buktningene bli større.
Scientists stunned by massive snowfall increases among Alaska’s highest peaks
Climate change increases the volume of precipitation, because a warmer atmosphere holds more water vapor.
But it isn’t supposed to increase it this much. The researchers
attribute part of the snowfall increase to the atmosphere’s retaining
more water vapor, but also say that the warming up of the tropical Pacific Ocean changed atmospheric patterns, leading more storms to track across Alaska — thus accounting for the one-two punch.
Konklusjon:
En lokal kaldværsdag har ingenting å gjøre med den langsiktige trenden bestående av en økende global temperatur. Global warming is not the end of freezing cold winters, its a shift towards more record lows than record highs.
Funny how AGW is a "leftist communist hoax" all the time, but as soon as some russian no one has ever heard of says something which suit their narrative, the communist thing is forgotten..strange....anyway..here is the Zharkova nonsense debunked:
A Russian scientist named Zharkova who doesn't understand the science she's studying is simply making stuff up for sensationalist headlines. Some of the fault lies with Zharkova, who made comments ‘skeptical’ of human-caused global warming that were not supported by her research.
The paper presents a model for the sun's magnetic field and sunspots, which predicts a 60% fall in sunspot numbers when extrapolated to the 2030s. Crucially, the paper makes no mention of climate.
The first failure of science communication is present in the Royal Astronomical Society press release from July 9. It says that "solar activity will fall by 60 per cent during the 2030s" without clarifying that this "solar activity" refers to a fall in the number of sunspots, not a dramatic fall in the life-sustaining light emitted by the sun.
The press release also omits crucial details. It does say that the drop in sunspots may resemble the Maunder minimum, a 17th century lull in solar activity, and includes a link to the Wikipedia article on the subject. The press release also notes that the Maunder minimum coincided with a mini ice age.
But that mini ice age began before the Maunder minimum and may have had multiple causes, including volcanism.
Crucially, the press release doesn't say what the implications of a future Maunder minimum are for climate.
To be blunt: no mini ice age for us. The real story of the impending mini ice age isn't about climate at all. It is a cautionary tale, of how science should and shouldn't be communicated. https://phys.org/news/2015-07-mini-ice-age-hoopla-giant.html
For reference, we are at about 400 right now and climbing, so we can be relatively sure the next glacial epoch won't be happening in our lifetimes.
But what about further down the road? What happens then? Per Dr Toby Tyrrell (Tyrrell 2007) of the University of Southampton's School of Ocean and Earth Science at the National Oceanography Centre, Southampton:
"Our research shows why atmospheric CO2 will not return to pre-industrial levels after we stop burning fossil fuels. It shows that it if we use up all known fossil fuels it doesn't matter at what rate we burn them.
The result would be the same if we burned them at present rates or at more moderate rates; we would still get the same eventual ice-age-prevention result."
"Burning all recoverable fossil fuels could lead to avoidance of the next five ice ages."
Per Ganopolski et al 2016,
"even in the absence of human perturbations no substantial build-up of ice sheets would occur within the next several thousand years and that the current interglacial would probably last for another 50,000 years. However, moderate anthropogenic cumulative CO2 emissions of 1,000 to 1,500 gigatonnes of carbon will postpone the next glacial inception by at least 100,000 years....under natural conditions alone the Earth system would be expected to remain in the present delicately balanced interglacial climate state, steering clear of both large-scale glaciation of the Northern Hemisphere and its complete deglaciation, for an unusually long time"
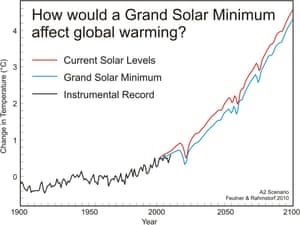
Feulner and Rahmstorf (2010) examined the impact on global warming if the sun fell into a Grand Solar Minimum. The global mean temperature difference is shown for the time period 1900 to 2100 for the IPCC A2 emissions scenario (relative to zero for the average temperature during the years 1961 to 1990). The red line shows predicted temperature change for the current level of solar activity, the blue line shows predicted temperature change for solar activity at the much lower level of the Maunder Minimum, and the black line shows observed temperatures from the NASA GISS dataset through 2010. The authors found that the average global surface temperature would be diminished by no more than 0.3°C due to the lower solar activity, which would offset only a small fraction of human-caused global warming.
Mange amatørfornektere vil jo og ha oss til å tro at dagens oppvarming kommer av at vi er på vei ut av, ikke le, Den Lille Istid. Study on the Little Ice Age: Low solar activity just marginally cools the climate.
The weakening sun was not the determinant factor for the Little Ice Age. Strong volcanic eruptions in particular, but also a smaller amount of greenhouse gases in the atmosphere were important factors during this period of cooler climate in the 16th and 17th century, a new study shows.
Impact of Volcanic Eruptions on Decadal to Centennial Fluctuations of Arctic Sea Ice Extent during the Last Millennium and on Initiation of the Little Ice Age
Global Signatures and Dynamical Origins of the Little Ice Age and Medieval Climate Anomaly Abstract
Global temperatures are known to have varied over the past 1500 years, but the spatial patterns have remained poorly defined. We used a global climate proxy network to reconstruct surface temperature patterns over this interval. The Medieval period is found to display warmth that matches or exceeds that of the past decade in some regions, but which falls well below recent levels globally. This period is marked by a tendency for La Niña–like conditions in the tropical Pacific. The coldest temperatures of the Little Ice Age are observed over the interval 1400 to 1700 C.E., with greatest cooling over the extratropical Northern Hemisphere continents. The patterns of temperature change imply dynamical responses of climate to natural radiative forcing changes involving El Niño and the North Atlantic Oscillation–Arctic Oscillation.
This implies that low solar activity, which is expected by some researchers for the coming decades, cannot considerably slow down global warming caused by humankind’s greenhouse gas emissions.
“The impact of variations in solar activity on the climate is often overestimated,” says Georg Feulner of the Potsdam Institute for Climate Impact Research (PIK). He is the author of the article just published in Geophysical Research Letters. “This is what our new analysis shows for the past – and we can learn from this to understand future climate change.”
The main drivers of the Little Ice Age cooling were decreased solar activity and increased volcanic activity. These factors cannot account for the global warming observed over the past 50-100 years. Furthermore, it is physically incorrect to state that the planet is simply "recovering" from the Little Ice Age. Research has suggested that the solar minimum around the year 1650 played a relatively small role in the cool temperatures during the Little Ice Age. Instead, heightened volcanic activity (pumping ash into the atmosphere that blocks sunlight) and a drop in atmospheric carbon levels were the main contributors to the cooling during that time. Third, the Little Ice Age wasn’t even that cold, globally. The following chart shows the most comprehensive global surface temperature reconstruction to date, from the PAGES 2k Consortium. In just the past few decades the planet has warmed more than it cooled during the entire Little Ice Age.
To sum up, a number of scientific studies have asked the question, ‘if the sun were to enter another extended quiet phase (a grand solar minimum), how would that impact global surface temperatures?’. Every study agrees, it would cause no more than 0.3°C cooling, which would only be enough to temporarily offset about a decade’s worth of human-caused global warming.
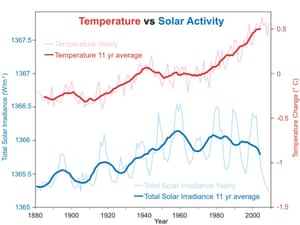
This ‘impending mini ice age’ myth is incredibly easy to debunk. In fact it just takes asking one simple question – if the sun is such a key driver of the Earth’s climate, then why has the entire planet (air, oceans, land, and ice) warmed rapidly over the past 60 years while solar activity has declined?
Annual global temperature change (thin light red) with 11 year moving average of temperature (thick dark red). Temperature from NASA GISS. Annual Total Solar Irradiance (thin light blue) with 11 year moving average of TSI (thick dark blue). TSI from 1880 to 1978 from Krivova et al 2007 (data). TSI from 1979 to 2009 from PMOD.
The reduced energy from the Sun sets into motion a sequence of events on Earth beginning with a thinning of the stratospheric ozone layer. That thinning in turn changes the temperature structure of the stratosphere, which then changes the dynamics of the lower atmosphere, especially wind and weather patterns. The cooling is not uniform. While areas of Europe chilled during the Maunder Minimum, other areas such as Alaska and southern Greenland warmed correspondingly.
Despite how much the Maunder Minimum might have affected Earth the last time, Lubin said that an upcoming event would not stop the current trend of planetary warming but might slow it somewhat. The cooling effect of a grand minimum is only a fraction of the warming effect caused by the increasing concentration of carbon dioxide in the atmosphere.After hundreds of thousands of years of CO2 levels never exceeding 300 parts per million in air, the concentration of the greenhouse gas is now over 400 parts per million, continuing a rise that began with the Industrial Revolution. Other researchers have used computer models to estimate what an event similar to a Maunder Minimum, if it were to occur in coming decades, might mean for our current climate, which is now rapidly warming.
One such study looked at the climate consequences of a future Maunder Minimum-type grand solar minimum, assuming a total solar irradiance reduced by 0.25 percent over a 50-year period from 2020 to 2070. The study found that after the initial decrease of solar radiation in 2020, globally averaged surface air temperature cooled by up to several tenths of a degree Celsius. By the end of the simulated grand solar minimum, however, the warming in the model with the simulated Maunder Minimum had nearly caught up to the reference simulation. Thus, a main conclusion of the study is that "a future grand solar minimum could slow down but not stop global warming."
Peer-reviewed research, physics, and math all tell us that a grand solar minimum would have no more than a 0.3°C cooling effect, barely enough to put a dent in human-caused global warming.
The idea of a Grand Solar Minimum (GSM) causing weather extremes, specifically cooling on parts of our planet today is deeply flawed (just wrong) and has no basis in reality. I clearly explain here how variability in sunspots cause tiny changes in solar output (0.5/1361 or 1 part in 2722), and changes in climate impact of about 0.05 in 2.7 which is eeny-weeny-teeny compared to greenhouse gas impacts. Also, solar cycles, reflected in sunspot counts, are on an 11 year timescale, which clearly cannot explain the abrupt climate change occurring.
Impact of a potential 21st century “grand solar minimum” on surface temperatures and stratospheric ozone
Bonus: Regional climate impacts of a possible future grand solar minimum
Any reduction in global mean near-surface temperature due to a future decline in solar activity is likely to be a small fraction of projected anthropogenic warming. However, variability in ultraviolet solar irradiance is linked to modulation of the Arctic and North Atlantic Oscillations, suggesting the potential for larger regional surface climate effects. Here, we explore possible impacts through two experiments designed to bracket uncertainty in ultraviolet irradiance in a scenario in which future solar activity decreases to Maunder Minimum-like conditions by 2050. Both experiments show regional structure in the wintertime response, resembling the North Atlantic Oscillation, with enhanced relative cooling over northern Eurasia and the eastern United States. For a high-end decline in solar ultraviolet irradiance, the impact on winter northern European surface temperatures over the late twenty-first century could be a significant fraction of the difference in climate change between plausible AR5 scenarios of greenhouse gas concentrations. https://www.nature.com/articles/ncomms8535
Are the most recent estimates for Maunder Minimum solar irradiance in agreement with temperature reconstructions?
"Those hoping that the sun could save us from climate change look set for disappointment. The recent lapse in solar activity is not the beginning of a decades-long absence of sunspots – a dip that might have cooled the climate. Instead, it represents a shorter, less pronounced downturn that happens every century or so."
Even if the sun got stuck in a permanent Maunder Minimum, the warming from our CO2 emissions will still warm our planet and continue to change our climate:
"Thus if the sun remains “out”, i.e., stuck for a long period in the current solar minimum, it can offset only about 7 years of CO2 increase. The human-made greenhouse gas climate forcing is now relentlessly, monotonically, increasing at a rate that overwhelms variability of natural climate forcings. Unforced variability of global temperature is great, as shown in Figure 4, but the global temperature trend on decadal and longer time scales is now determined by the larger human-made climate forcing. Speculation that we may have entered a solar-driven long-term cooling trend must be dismissed as a pipe-dream." bravenewclimate.com/2008/09/14/what-if-the-sun-got-stuck/
"this "solar activity" refers to a fall in the number of sunspots, not a dramatic fall in the life-sustaining light emitted by the sun."
And
"As discussed previously, the impact of a new Maunder minimum on climate has been studied many times. There's 40% more CO2 in the air now than during the 17th century, and global temperature records are being smashed. A new Maunder minimum would slow climate change, but it is not enough to stop it."
And to complete the debunking:
"In plain English, the small change in sunlight reaching the Earth during a new Maunder minimum wouldn't be enough to reverse climate change. For the technically minded, even a 3 W per m2 change in irradiance corresponds to a radiative forcing of just 0.5 W per m2 (because the Earth is a sphere and not a flat circle), which is less than the radiative forcing produced by anthropogenic greenhouse gases.
The analysis techniques used to underpin the prediction of very low sunspot numbers (principal component analysis) is well known and ‘valid’ as to what it does. Using it to project into the future is somewhat less valid, as other factors which have not shown up in the past data may be waiting in the wings. I guess I would rate the chances of very low sunspot numbers in the 2030s as less than 50-50, but certainly not at, or close to, zero.
So that brings us to the more important issue of the impacts. The Little
Ice Age (so-called) is certainly ‘real’, although many questions
remain. When did it begin? I’ve seen dates of anywhere from 1300 to 1450 – both well before the start of the Maunder Minimum in 1645.
When did it end? Again I’ve seen dates as late as 1850 (well after the
end of the MM in 1715), which might well imply that the only reason it
did end is the onset of global warming!
Was it global, or regional? There is plenty of evidence from Europe and
some from North America. I’ve seen a suggestion of some evidence from
New Zealand. However there do seem to be many questions around the
uniformity of the cooling.
So that brings us to the really key question of the causes/drivers.
Solar activity is certainly one possibility, although as I’ve indicated
the MM certainly couldn’t have started it. It may have made things just a
little bit cooler – say 0.2 C – but it wasn’t the cause! Other
suggestions have been a slowing of the Gulf Stream (it has slowed
significantly in the past. ~11,000 years ago); volcanic activity (a
couple of major eruptions followed by some feedbacks); and ‘orbital
forcing’. We know that changes in the Earth’s orbit are the drivers of
the glacial-interglacial cycle (something one of the authors of the
paper in question is clearly ignorant of!), and these drivers don’t stop
and start, but are on-going. We probably are heading ever so slowly for
the next glacial.
Like most scientists who have made ‘meaningful’ comments, my view is
that, if it does happen, it will reduce global warming by ~0.1 C – or
delay it by ~10 years. And that delay would only be temporary, and
temperature would zoom ahead in the years that followed.
Nå går "spagetti"-grafen til IPPC rundt i amatør-fornekter-ekkokammer bloggene. Startet global oppvarming for 400 år siden?
The IPPC "spaghetti-graph is being recycled in the amateur denier echo chamber bloggs these days. Did GW start 400 years ago?
For everyone who needs the graph explained AND to end all these silly misinterpretations of the graph:
Here is what the IPPC report says about the graph (fig 5.7)
"The median of the NH temperature reconstructions (Figure 5.7) indicates mostly warm conditions from about 950 to about 1250 and colder conditions from about 1450 to about 1850; these time intervals are chosen here to represent the MCA and the LIA, respectively."
THERE IS NO DOUBT, THE WARMING CAUSED BY HUMANS STARTED CA 1850:
The Medieval Warm Period and The Little Ice age was also NOT global, like todays warming is (and which also includes the oceans).
The similarity of characteristics among the different paleoclimate reconstructions of the last 2,000 years provides confidence in the following important conclusions, as reported in the Intergovernmental Panel on Climate Change Fifth Assessment Report: Dramatic warming has occurred since the 19th century.
For average annual Northern Hemisphere temperatures, the period 1983–2012 was very likely the warmest 30-year period of the last 800 years and likely the warmest 30-year period of the last 1,400 years. Warmer than average temperatures are more widespread over the Northern Hemisphere since the mid 20th century than in any previous time.
Når amatør-fornekterne tror at gamle avisartikler og historier om forskningsskip som "sitter fast i isen" "motbeviser" Global Oppvarming eller prøver å fortelle oss at dagens oppvarming ikke er noe spesiell.
Denne teksten har gått sin runddans i kokohhøyre propagandablogger og i klimafornekterkretser i åresvis. Den er basert på en artikkel som er ekte nok, men senere versjoner har lagt til den falske setningen
"Within a few years it is predicted that due to the ice melt the sea will rise and make most coast cities uninhabitable".
"This implies that this article – when seen in context – is actually strongly confirming of a considerable decline in Arctic sea ice over the last 90 years. Not that CFACT is going to tweet that."
"The warming phenomena observed in 1922 proved to be indicative only of a local event in Spitzbergen, not a trend applicable to the Arctic as a whole.
Those who seek to deny global warming constantly use transparently obvious
tricks, selecting data from a single time, a single place, or both, to deny the larger
long-term global patterns. This is easily done as climate is constantly fluctuating,
so picking out the mean patterns and trends requires that one integrates the data
over the largest time and space scales possible. So if one dishonestly wants to
misrepresent the larger patterns, one can always find a particular place at a
particular time that does not agree with the all the rest averaged together. This is
sometimes referred to as the “It’s a cold day in Wagga Wagga” approach, and is
repeatedly used by the climate change deniers to fool people who haven’t looked
at the data themselves. The changes in Arctic Ice are no exception! [...]
Note that there are year to year fluctuations of about 1 million square kilometers, due to annual weather variations. These spatial variations have been used by deniers who simply look at changes since 2007, an exceptionally warm year in the Arctic, to suggest that the Arctic is cooling down! In other words they are simply picking ONE point that falls a bit off the trend of ALL the data to deny the long-term trend.
This set of observations from a limited area (Spitzbergen) in one year has been used by deniers to suggest that there are huge natural fluctuations, and to imply that there is no global warming. Now since the satellite data only goes back to 1979, it is perfectly legitimate to suggest that the trends since 1979 may not match the trends when looked at over a longer time period. One has to look at long-term data from ice extent measured in the sea and from shore, and air and water temperature data, over the longest time periods available. So let’s look at what this data actually shows!
Here are the measured long-term Arctic (red) and Antarctic (green) temperatures
trends:
Artic warming trend from NOAA:
Highlights
The average annual surface air temperature anomaly over land north of 60° N for October 2015-September 2016 (+2.0° C, relative to a 1981-2010 baseline) was by far highest in the observational record beginning in 1900; this represents a 3.5° C increase since the beginning of the 20th Century.
Arctic temperatures continue to increase at double the rate of the global temperature increase.
Extreme Arctic-wide air warm temperatures in winter 2016 (Jan-Mar) greatly exceeding the previous record; several locations showed January anomalies exceeding +8° C. These conditions were primarily due to southerly winds moving warm air into the Arctic from mid-latitudes and the presences of sea ice free areas to the northeast of Novaya Zemlya.
Neutral to cold temperature anomalies occurred across the central Arctic Ocean in summer 2016; a condition which did not support rapid summer sea ice loss.
Arctic (land stations north of 60° N) and global mean annual land surface air temperature (SAT) anomalies (in °C) for the period 1900-2016 relative to the 1981-2010 mean value:
Abstract From the 1920s to the 1940s, the Artic experienced significant warming that is comparable to the recent 30-year warming. The former warming was concentrated mostly in high latitudes, in contrast to the recent 30-year warming, which has occurred in all latitudes. Several explanations have been proposed; however, one of these proposed explanations, single external forcing, which could once explain the global average, failed to explain the early 20th century scenario. A second possible explanation was internal atmospheric variability with low frequency. Another candidate for the explanation was still forcing by black carbon deposited on snow and ice surfaces. The answer is most likely to be a combination of intrinsic internal natural climate variability and positive feedbacks that amplified the radiative and atmospheric forcing. We must continue our study by discovering historical data, analyzing ice cores, reanalyzing the Arctic system together with long-term reanalysis dating back to the 1880s, and also determine the contributions of each factor. https://www.sciencedirect.com/science/article/pii/S1873965211000053
There is no large-scale warmth during 1922 visible.
Next let’s look at the long term measured sea surface temperature anomaly (the difference with the long term average) of Arctic temperature.
It is clear that what happened in Spitzbergen in 1922 does NOT represent the Arctic as a whole!
Finally, let’s look at the measured ice extent in the places where there is good
long-term data, in Iceland, the Nordic Sea, and the Norwegian Sea (in other
words in the region of the Arctic most affected by fluctuations in the Gulf Stream)
and including Sptizbergen where the 1922 observation came from. First let’s look
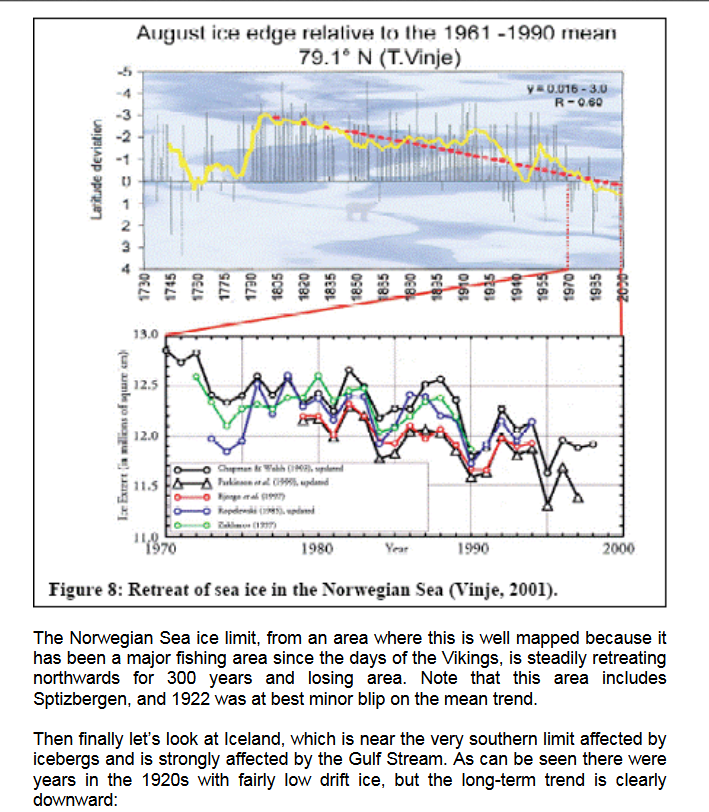
at the Nordic Sea, where the ice is retreating in both east and west, and 1922 is
not a blip:
Then finally let’s look at Iceland, which is near the very southern limit affected by icebergs and is strongly affected by the Gulf Stream. As can be seen there were years in the 1920s with fairly low drift ice, but the long-term trend is clearly downward:
Den globale gjennomsnittlige overflatetemperaturen er kanskje det mest representative målet på en planetens klima, da den reflekterer hvor mye varme det er på overflaten. Lokale temperaturendringer kan variere markant fra det globale gjennomsnittet. En årsak til dette er at varmen beveger seg rundt med vind og havstrømmer, den varmer opp en region mens den kjøler en annen, men disse regionale effektene kan ikke forårsake en signifikant endring i den globale gjennomsnittstemperaturen. En annen grunn er at lokal albedo, for eksempel endringer i snø eller vegetasjon, som påvirker hvordan en region reflekterer eller absorberer sollys, kan forårsake store lokale temperaturendringer som ikke speiles i det globale gjennomsnittet. Vi kan derfor ikke stole på ett spesifikt sted til å være representativ for global temperaturendring.
Global average surface temperature is perhaps the single most representative measure of a planet’s climate since it reflects how much heat is at the planet’s surface. Local temperature changes can differ markedly from the global average. One reason for this is that heat moves around with the winds and ocean currents, warming one region while cooling another, but these regional effects might not cause a significant change in the global average temperature. A second reason is that local feedbacks, such as changes in snow or vegetation cover that affect how a region reflects or absorbs sunlight, can cause large local temperature changes that are not mirrored in the global average. We therefore cannot rely on any single location as being representative of global temperature change.
Although most locations on the planet have recorded increased temperatures since 1900, changes in global ocean and atmospheric circulation patterns have created small-scale temperature decreases in a few local regions.
To end, let’s point out that the Arctic region will be the site of some of the major
global positive climate feedbacks, that is to say those processes that will act
strongly to AMPLIFY global warming, and whose effects are only STARTING to
be felt and will get much stronger in coming years:
1) Ice albedo feedback. An aerial image of the Arctic Ice cap shows that the
ocean looks deep blue, nearly black in comparison with ice. The white ice reflects
sunlight back to space, reducing warming, while the dark ocean absorbs the light,
increasing warming. As ice is replaced by ocean, global warming will accelerate.
2) Land albedo feedback. As the land warms up, trees and forests migrate north.
White snow that reflects sunlight back to space is covered with dark green leaves
or dark brown tree trunks and branches, which absorb sunlight and convert it to
heat, with the same effect of amplifying global warming.
3) Tundra permafrost melting Greenhouse gas release feedback. As the tundra
permafrost is steadily melting, vast amounts of methane gas trapped beneath in
soils, peat, sediments, and ice-like methane hydrates are bubbling up into the
atmosphere. This is a greenhouse gas many times more potent than CO2, and
its release is rapidly escalating in Siberia, Canada, Alaska, and the Arctic Ocean.
4) Peat oxidation feedback. As frozen tundra peat melts, the frozen organic
matter, the world’s largest store of soil carbon, several times larger than that in
the atmosphere, is being broken down by microorganisms and released as CO2
to the atmosphere.
BONUS:
Ice Loss and the Polar Vortex: How a Warming Arctic Fuels Cold Snaps
Frost fairs på Themsen, sunspots and the Little Ice Age
Where spin doctors, politicians and newspaper editors understand well that a name alters how something is perceived, scientists know that a name does not change the reality one iota. By virtue of the name awarded to it, the “Little Ice Age” has been associated with full ice ages. The name Little Ice Age has also become almost synonymous with the Maunder minimum in solar activity in the minds of many people. Hence it has even become possible to build semantic arguments that imply there is some sort of link between solar activity and ice ages – and evidence for major control of climate by solar activity is often offered in the form of the occurrence of frost fairs on the Thames in London. This paper discusses the true relationships, or lack of them, between these different events. https://www.reading.ac.uk/news-and-events/releases/PR717721.aspx
Bonus: Regional climate impacts of a possible future grand solar minimum Any reduction in global mean near-surface temperature due to a future decline in solar activity is likely to be a small fraction of projected anthropogenic warming. However, variability in ultraviolet solar irradiance is linked to modulation of the Arctic and North Atlantic Oscillations, suggesting the potential for larger regional surface climate effects. Here, we explore possible impacts through two experiments designed to bracket uncertainty in ultraviolet irradiance in a scenario in which future solar activity decreases to Maunder Minimum-like conditions by 2050. Both experiments show regional structure in the wintertime response, resembling the North Atlantic Oscillation, with enhanced relative cooling over northern Eurasia and the eastern United States. For a high-end decline in solar ultraviolet irradiance, the impact on winter northern European surface temperatures over the late twenty-first century could be a significant fraction of the difference in climate change between plausible AR5 scenarios of greenhouse gas concentrations.
Global Signatures and Dynamical Origins of the Little Ice Age and Medieval Climate Anomaly Abstract
Global temperatures are known to have varied over the past 1500 years, but the spatial patterns have remained poorly defined. We used a global climate proxy network to reconstruct surface temperature patterns over this interval. The Medieval period is found to display warmth that matches or exceeds that of the past decade in some regions, but which falls well below recent levels globally. This period is marked by a tendency for La Niña–like conditions in the tropical Pacific. The coldest temperatures of the Little Ice Age are observed over the interval 1400 to 1700 C.E., with greatest cooling over the extratropical Northern Hemisphere continents. The patterns of temperature change imply dynamical responses of climate to natural radiative forcing changes involving El Niño and the North Atlantic Oscillation–Arctic Oscillation.
While England had 42 vineyards at the time of the Domesday Book, as is well known, there are now over 300 commercial English vineyards today. So the climate today in England is much more conducive to wine-making than during the Roman occupation of England.
By 1977, there were 124 reasonable-sized vineyards in production – more than at any other time over the previous millennium. The website of the English wine producers suggests that at present extent of vineyards in Britain probably surpasses that of the Medieval Warm Period between circa 900 AD to 1300 AD.
Det er blitt nesten 900 vingårder i England og Wales. Salget gikk opp 69 prosent fra 2019 til 2021.
Sea ice can't be in decline until it has completely disappeared?
You're just like the people saying the coronavirus can't kill Alaskans because it hasn't killed many yet.
Klimafornekterne har produsert hundrevis av artikler om forskningsskip som sitter fast i is
og følger opp med å kirsebærplukke bilder fra NASA som viser at isen i
arktis har vokst. De har heller ingen problemer med å hente sine klimaløgner selv fra alt-right white supremacy-rasist koko-høyre blogger som breitbart. (Hvorfor går de ikke videre til den NASA-siden som har
bevisene for AGW?)
Mengden sjøis er en nedadgående trend. Den er ikke borte. Dette betyr at den fremdeles er der og kan fange skip. Til den faktisk blir borte. Er det vanskelig å forstå? Har du 20 krabbeteiner i sjøen og reduserer antallet til 10, slutter du ikke å fange krabber. Du fanger bare færre.
INGENTING av
dette motbeviser global oppvarming. Det nevnte skipet måtte avbryte på
grunn av mye is i bevegelse, et resultat av global oppvarming
"Climate-related changes in Arctic sea ice not only reduce its extent
and thickness but also increase its mobility meaning that ice conditions are likely to become more variable and severe conditions such as these will occur more often."
Antarctic Ship Rescue: 5 Lessons From the Trapped-Vessel Drama
Kevin Trenberth, senior scientist at the National Center for Atmospheric Research, added by email that "any comments about overall ice shrinking or increasing are absurd in this situation.
"In the Antarctic, the ice is not limited by land and it is well established that winds blow the ice around. Winds from the south, especially off the continent, carry ice away from the continent and create more ice behind, filling in any gaps."
As Arctic sea ice breaks up, it’s starting to move southward faster, creating new and unexpected hazards. More icebergs calving off Greenland add to the threat.
he Multidisciplinary drifting Observatory for the Study of Arctic Climate (MOSAiC), is on a yearlong expedition to study Arctic ice in the central region of the Arctic. Recently, the German research icebreaker Polarstern, the MOSAIC expedition ship, sailed from the northern part of the Fram Strait to the North Pole by following a route along the northern border of Greenland, which in the past was packed with thick, multi-year sea ice, and was virtually impassible throughout the year. But this year offered smooth sailing for the icebreaker all the way to the North Pole, demonstrating the profound loss of multi-year sea ice in Arctic, and suggesting ice-free Arctic summers by 2035 is not a theoretical scenario but rather an unavoidable fact
Its the third time in a very short time Ive heard this Dr Viner quote about "no more snow" or "our children wont see anymore snow" bla bla bla, and then they combine the quote with a link to some cold weather event in England.
So I did a debunking of it:
Dr David Viner at CRU, England, never said that "Snowfalls are now just a thing of the past.". That was the headline the newspaper choose for their article, making it more sensational but losing the plot.
Dr Viner was also quoted as saying: "We're really going to get caught out. Snow will probably cause chaos in 20 years time."
The headline in this case is not what the story itself said, as Dr Viner made clear. The story was about the frequency of snowfalls, and how "snow is starting to disappear from our lives", which it stated clearly.
So a headline saying that "snowfalls are now just a thing of the past" is not a scientific prediction or statement. It is a newspaper headline, and should be treated as an invitation to read the entire story, which in this case clearly pointed out that snowfalls are becoming less frequent in Britain.
"A more accurate headline would be something like: "Snowfalls are becoming less frequent in our little corner of the world but that doesn't necessarily mean that snow will disappear from our lives completely and forever." Unfortunately, any sub-editor who would suggest such a tediously long headline is unlikely to last very long."
Dr David Viner ved CRU, England, sa aldri at "snøen vil forsvinne".
Det var overskriften avisen valgte på intervjuet , noe som gjorde saken mer oppsiktsvekkende, men som mistet poenget.
Dr Viner sa i tillegg
-Vi kommer virkelig til å bli tatt på sengen. Snø vil sannsynligvis forårsake kaos om 20 år!
Historien handlet om hyppigheten av snøfall, og hvordan "snøen begynner å forsvinne fra livene våre", som den tydelig sa.
Så en overskrift som sier at "snøfall er nå bare en ting fra fortiden" er ikke en vitenskapelig spådom eller uttalelse.
Det er en avisoverskrift, og bør behandles som en invitasjon til å lese hele historien, som i dette tilfellet tydelig påpekte at snøfall blir mindre hyppige i Storbritannia.
Anyway. Climate science dont make predictions based on a newspaper interview with one (1) scientist. Its the combined knowledge from thousands of scientists world wide. Look for the predictions in the peer reviewed science and the peer reviewed reports.
Like this one out from the USA in the autumn of 2017 which was peer reviewed by the National Academy of Sciences, the worlds most respected scientific academy, founded by Abraham Lincoln and with 200 Nobel Prize winners as members.
For regions that are less than 1000m above sea level and that currently experience winter temperatures just below freezing, he found that the chance of an extreme snowfall event will drop by an average of just 8%. But the total amount of snow that falls in these areas each winter may drop by as much as 65%, on average. http://www.bbc.com/earth/story/20160127-will-snow-become-a-thing-of-the-past-as-the-climate-warms
Vitenskapen er god til å projektere . Aviser er dårlige på spådommer. Aviser er ofte elendige til å formidle hva forskningen faktisk sier. Det er veldig lett å debunke avisspådommer.
Dr David Viner ved CRU, England, sa aldri at "Britiske barn vil ikke lenger vite hva snø er." Det var overskriften avisen valgte for artikkelen, noe som gjorde den mer sensasjonell (clickbait) , men som dessverre gjorde at den mistet tråden.
Dr Viner sa og: "We're really going to get caught out. Snow will probably cause chaos in 20 years time."
Overskriften i dette tilfellet reflekterer altså ikke hva intervjuet handlet om , som Dr. Viner gjorde klart. Historien handlet om hyppigheten av snøfall, og hvordan "snø begynner å forsvinne fra livene våre".
En overskrift som sier at "snøfall er nå bare en ting fra fortiden" er ikke en vitenskapelig projeksjon . Det er en avisoverskrift, og bør behandles som en invitasjon til å lese hele historien, som i dette tilfellet tydelig påpekte at snøfall blir mindre hyppig i Storbritannia.
"A more accurate headline would be something like: "Snowfalls are becoming less frequent in our little corner of the world but that doesn't necessarily mean that snow will disappear from our lives completely and forever." Unfortunately, any sub-editor who would suggest such a tediously long headline is unlikely to last very long."
Uansett. Klimavitenskapen er aldri basert på et avisintervju med en (1) forsker. Men den kombinerte kunnskapen fra tusenvis av forskere over hele verden. Se etter vitenskapen i fagfellevurderte vitenskap og fagfellevurderte rapporter. Ikke i aviser.