Når amatør-fornekterne tror at gamle avisartikler og historier om forskningsskip som "sitter fast i isen" "motbeviser" Global Oppvarming eller prøver å fortelle oss at dagens oppvarming ikke er noe spesiell.

Denne teksten har gått sin runddans i kokohhøyre propagandablogger og i klimafornekterkretser i åresvis. Den er basert på en artikkel som er ekte nok, men senere versjoner har lagt til den falske setningen
"Within a few years it is predicted that due to the ice melt the sea will rise and make most coast cities uninhabitable".

"This implies that this article – when seen in context – is actually strongly confirming of a considerable decline in Arctic sea ice over the last 90 years. Not that CFACT is going to tweet that."
"The warming phenomena observed in 1922 proved to be indicative only of a local event in Spitzbergen, not a trend applicable to the Arctic as a whole.
Those who seek to deny global warming constantly use transparently obvious
tricks, selecting data from a single time, a single place, or both, to deny the larger
long-term global patterns. This is easily done as climate is constantly fluctuating,
so picking out the mean patterns and trends requires that one integrates the data
over the largest time and space scales possible. So if one dishonestly wants to
misrepresent the larger patterns, one can always find a particular place at a
particular time that does not agree with the all the rest averaged together. This is
sometimes referred to as the “It’s a cold day in Wagga Wagga” approach, and is
repeatedly used by the climate change deniers to fool people who haven’t looked
at the data themselves. The changes in Arctic Ice are no exception! [...]
Note that there are year to year fluctuations of about 1 million square kilometers, due to annual weather variations. These spatial variations have been used by deniers who simply look at changes since 2007, an exceptionally warm year in the Arctic, to suggest that the Arctic is cooling down! In other words they are simply picking ONE point that falls a bit off the trend of ALL the data to deny the long-term trend.
This set of observations from a limited area (Spitzbergen) in one year has been used by deniers to suggest that there are huge natural fluctuations, and to imply that there is no global warming. Now since the satellite data only goes back to 1979, it is perfectly legitimate to suggest that the trends since 1979 may not match the trends when looked at over a longer time period. One has to look at long-term data from ice extent measured in the sea and from shore, and air and water temperature data, over the longest time periods available. So let’s look at what this data actually shows!
Here are the measured long-term Arctic (red) and Antarctic (green) temperatures trends:

Artic warming trend from NOAA:
Arctic (land stations north of 60° N) and global mean annual land surface air temperature (SAT) anomalies (in °C) for the period 1900-2016 relative to the 1981-2010 mean value:

Fig. 1.1. Arctic (land stations north of 60° N) and global mean annual land surface air temperature (SAT) anomalies (in °C) for the period 1900-2016 relative to the 1981-2010 mean value. Note that there were few stations in the Arctic, particularly in northern Canada, before 1940. The data are from the CRUTEM4 dataset, which is available at www.cru.uea.ac.uk/cru/data/temperature/.
http://www.arctic.noaa.gov/Report-Card/Report-Card-2016/ArtMID/5022/ArticleID/271/Surface-Air-Temperature
Abstract
From the 1920s to the 1940s, the Artic experienced significant warming that is comparable to the recent 30-year warming. The former warming was concentrated mostly in high latitudes, in contrast to the recent 30-year warming, which has occurred in all latitudes. Several explanations have been proposed; however, one of these proposed explanations, single external forcing, which could once explain the global average, failed to explain the early 20th century scenario. A second possible explanation was internal atmospheric variability with low frequency. Another candidate for the explanation was still forcing by black carbon deposited on snow and ice surfaces. The answer is most likely to be a combination of intrinsic internal natural climate variability and positive feedbacks that amplified the radiative and atmospheric forcing. We must continue our study by discovering historical data, analyzing ice cores, reanalyzing the Arctic system together with long-term reanalysis dating back to the 1880s, and also determine the contributions of each factor.
https://www.sciencedirect.com/science/article/pii/S1873965211000053

There is no large-scale warmth during 1922 visible.
Next let’s look at the long term measured sea surface temperature anomaly (the difference with the long term average) of Arctic temperature.
Note that there are year to year fluctuations of about 1 million square kilometers, due to annual weather variations. These spatial variations have been used by deniers who simply look at changes since 2007, an exceptionally warm year in the Arctic, to suggest that the Arctic is cooling down! In other words they are simply picking ONE point that falls a bit off the trend of ALL the data to deny the long-term trend.
This set of observations from a limited area (Spitzbergen) in one year has been used by deniers to suggest that there are huge natural fluctuations, and to imply that there is no global warming. Now since the satellite data only goes back to 1979, it is perfectly legitimate to suggest that the trends since 1979 may not match the trends when looked at over a longer time period. One has to look at long-term data from ice extent measured in the sea and from shore, and air and water temperature data, over the longest time periods available. So let’s look at what this data actually shows!
Here are the measured long-term Arctic (red) and Antarctic (green) temperatures trends:

Artic warming trend from NOAA:
Highlights
- The average annual surface air temperature anomaly over land north of 60° N for October 2015-September 2016 (+2.0° C, relative to a 1981-2010 baseline) was by far highest in the observational record beginning in 1900; this represents a 3.5° C increase since the beginning of the 20th Century.
- Arctic temperatures continue to increase at double the rate of the global temperature increase.
- Extreme Arctic-wide air warm temperatures in winter 2016 (Jan-Mar) greatly exceeding the previous record; several locations showed January anomalies exceeding +8° C. These conditions were primarily due to southerly winds moving warm air into the Arctic from mid-latitudes and the presences of sea ice free areas to the northeast of Novaya Zemlya.
- Neutral to cold temperature anomalies occurred across the central Arctic Ocean in summer 2016; a condition which did not support rapid summer sea ice loss.

Fig. 1.1. Arctic (land stations north of 60° N) and global mean annual land surface air temperature (SAT) anomalies (in °C) for the period 1900-2016 relative to the 1981-2010 mean value. Note that there were few stations in the Arctic, particularly in northern Canada, before 1940. The data are from the CRUTEM4 dataset, which is available at www.cru.uea.ac.uk/cru/data/temperature/.
http://www.arctic.noaa.gov/Report-Card/Report-Card-2016/ArtMID/5022/ArticleID/271/Surface-Air-Temperature
Abstract
From the 1920s to the 1940s, the Artic experienced significant warming that is comparable to the recent 30-year warming. The former warming was concentrated mostly in high latitudes, in contrast to the recent 30-year warming, which has occurred in all latitudes. Several explanations have been proposed; however, one of these proposed explanations, single external forcing, which could once explain the global average, failed to explain the early 20th century scenario. A second possible explanation was internal atmospheric variability with low frequency. Another candidate for the explanation was still forcing by black carbon deposited on snow and ice surfaces. The answer is most likely to be a combination of intrinsic internal natural climate variability and positive feedbacks that amplified the radiative and atmospheric forcing. We must continue our study by discovering historical data, analyzing ice cores, reanalyzing the Arctic system together with long-term reanalysis dating back to the 1880s, and also determine the contributions of each factor.
https://www.sciencedirect.com/science/article/pii/S1873965211000053

There is no large-scale warmth during 1922 visible.
Next let’s look at the long term measured sea surface temperature anomaly (the difference with the long term average) of Arctic temperature.
It is clear that what happened in Spitzbergen in 1922 does NOT represent the Arctic as a whole!
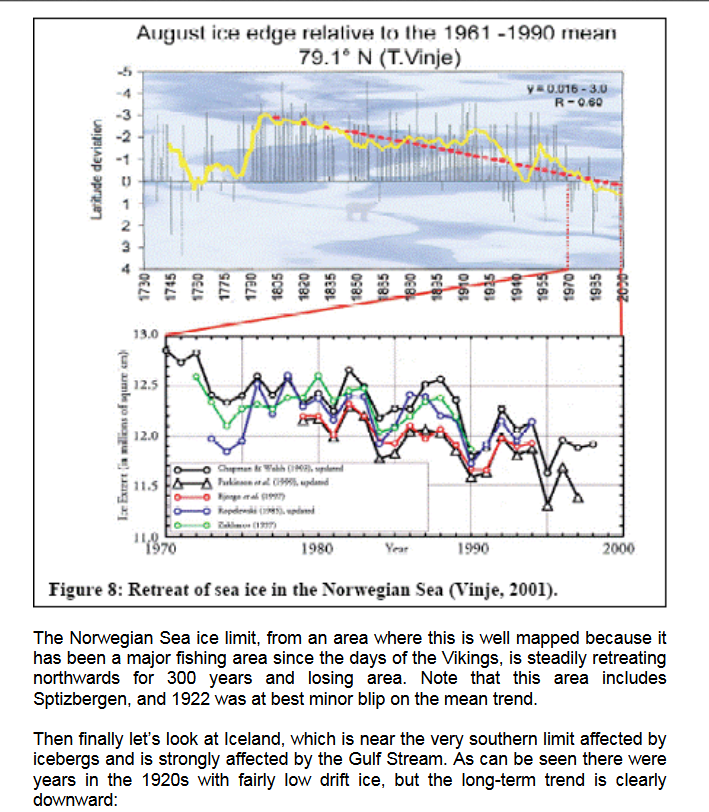
Finally, let’s look at the measured ice extent in the places where there is good long-term data, in Iceland, the Nordic Sea, and the Norwegian Sea (in other words in the region of the Arctic most affected by fluctuations in the Gulf Stream) and including Sptizbergen where the 1922 observation came from. First let’s look at the Nordic Sea, where the ice is retreating in both east and west, and 1922 is not a blip:

Then finally let’s look at Iceland, which is near the very southern limit affected by icebergs and is strongly affected by the Gulf Stream. As can be seen there were years in the 1920s with fairly low drift ice, but the long-term trend is clearly downward:
Finally, let’s look at the measured ice extent in the places where there is good long-term data, in Iceland, the Nordic Sea, and the Norwegian Sea (in other words in the region of the Arctic most affected by fluctuations in the Gulf Stream) and including Sptizbergen where the 1922 observation came from. First let’s look at the Nordic Sea, where the ice is retreating in both east and west, and 1922 is not a blip:
Then finally let’s look at Iceland, which is near the very southern limit affected by icebergs and is strongly affected by the Gulf Stream. As can be seen there were years in the 1920s with fairly low drift ice, but the long-term trend is clearly downward:

Den globale gjennomsnittlige overflatetemperaturen er kanskje det mest representative målet på en planetens klima, da den reflekterer hvor mye varme det er på overflaten. Lokale temperaturendringer kan variere markant fra det globale gjennomsnittet. En årsak til dette er at varmen beveger seg rundt med vind og havstrømmer, den varmer opp en region mens den kjøler en annen, men disse regionale effektene kan ikke forårsake en signifikant endring i den globale gjennomsnittstemperaturen. En annen grunn er at lokal albedo, for eksempel endringer i snø eller vegetasjon, som påvirker hvordan en region reflekterer eller absorberer sollys, kan forårsake store lokale temperaturendringer som ikke speiles i det globale gjennomsnittet. Vi kan derfor ikke stole på ett spesifikt sted til å være representativ for global temperaturendring.
Global average surface temperature is perhaps the single most representative measure of a planet’s climate since it reflects how much heat is at the planet’s surface. Local temperature changes can differ markedly from the global average. One reason for this is that heat moves around with the winds and ocean currents, warming one region while cooling another, but these regional effects might not cause a significant change in the global average temperature. A second reason is that local feedbacks, such as changes in snow or vegetation cover that affect how a region reflects or absorbs sunlight, can cause large local temperature changes that are not mirrored in the global average. We therefore cannot rely on any single location as being representative of global temperature change.

Although most locations on the planet have recorded increased temperatures since 1900, changes in global ocean and atmospheric circulation patterns have created small-scale temperature decreases in a few local regions.
Artic temperatures:

http://sites.uci.edu/zlabe/arctic-temperatures/
To end, let’s point out that the Arctic region will be the site of some of the major global positive climate feedbacks, that is to say those processes that will act strongly to AMPLIFY global warming, and whose effects are only STARTING to be felt and will get much stronger in coming years:
1) Ice albedo feedback. An aerial image of the Arctic Ice cap shows that the ocean looks deep blue, nearly black in comparison with ice. The white ice reflects sunlight back to space, reducing warming, while the dark ocean absorbs the light, increasing warming. As ice is replaced by ocean, global warming will accelerate.
2) Land albedo feedback. As the land warms up, trees and forests migrate north. White snow that reflects sunlight back to space is covered with dark green leaves or dark brown tree trunks and branches, which absorb sunlight and convert it to heat, with the same effect of amplifying global warming.
3) Tundra permafrost melting Greenhouse gas release feedback. As the tundra permafrost is steadily melting, vast amounts of methane gas trapped beneath in soils, peat, sediments, and ice-like methane hydrates are bubbling up into the atmosphere. This is a greenhouse gas many times more potent than CO2, and its release is rapidly escalating in Siberia, Canada, Alaska, and the Arctic Ocean.
4) Peat oxidation feedback. As frozen tundra peat melts, the frozen organic matter, the world’s largest store of soil carbon, several times larger than that in the atmosphere, is being broken down by microorganisms and released as CO2 to the atmosphere.
BONUS:
Ice Loss and the Polar Vortex: How a Warming Arctic Fuels Cold Snaps
Global average surface temperature is perhaps the single most representative measure of a planet’s climate since it reflects how much heat is at the planet’s surface. Local temperature changes can differ markedly from the global average. One reason for this is that heat moves around with the winds and ocean currents, warming one region while cooling another, but these regional effects might not cause a significant change in the global average temperature. A second reason is that local feedbacks, such as changes in snow or vegetation cover that affect how a region reflects or absorbs sunlight, can cause large local temperature changes that are not mirrored in the global average. We therefore cannot rely on any single location as being representative of global temperature change.
Although most locations on the planet have recorded increased temperatures since 1900, changes in global ocean and atmospheric circulation patterns have created small-scale temperature decreases in a few local regions.
Artic temperatures:

http://sites.uci.edu/zlabe/arctic-temperatures/
To end, let’s point out that the Arctic region will be the site of some of the major global positive climate feedbacks, that is to say those processes that will act strongly to AMPLIFY global warming, and whose effects are only STARTING to be felt and will get much stronger in coming years:
1) Ice albedo feedback. An aerial image of the Arctic Ice cap shows that the ocean looks deep blue, nearly black in comparison with ice. The white ice reflects sunlight back to space, reducing warming, while the dark ocean absorbs the light, increasing warming. As ice is replaced by ocean, global warming will accelerate.
2) Land albedo feedback. As the land warms up, trees and forests migrate north. White snow that reflects sunlight back to space is covered with dark green leaves or dark brown tree trunks and branches, which absorb sunlight and convert it to heat, with the same effect of amplifying global warming.
3) Tundra permafrost melting Greenhouse gas release feedback. As the tundra permafrost is steadily melting, vast amounts of methane gas trapped beneath in soils, peat, sediments, and ice-like methane hydrates are bubbling up into the atmosphere. This is a greenhouse gas many times more potent than CO2, and its release is rapidly escalating in Siberia, Canada, Alaska, and the Arctic Ocean.
4) Peat oxidation feedback. As frozen tundra peat melts, the frozen organic matter, the world’s largest store of soil carbon, several times larger than that in the atmosphere, is being broken down by microorganisms and released as CO2 to the atmosphere.
BONUS:
Ice Loss and the Polar Vortex: How a Warming Arctic Fuels Cold Snaps
Where spin doctors, politicians and newspaper editors understand well that a name alters how something is perceived, scientists know that a name does not change the reality one iota. By virtue of the name awarded to it, the “Little Ice Age” has been associated with full ice ages. The name Little Ice Age has also become almost synonymous with the Maunder minimum in solar activity in the minds of many people. Hence it has even become possible to build semantic arguments that imply there is some sort of link between solar activity and ice ages – and evidence for major control of climate by solar activity is often offered in the form of the occurrence of frost fairs on the Thames in London. This paper discusses the true relationships, or lack of them, between these different events.
https://www.reading.ac.uk/news-and-events/releases/PR717721.aspx
While England had 42 vineyards at the time of the Domesday Book, as is well known, there are now over 300 commercial English vineyards today. So the climate today in England is much more conducive to wine-making than during the Roman occupation of England.
www.english-wine.com/vineyards.html
By 1977, there were 124 reasonable-sized vineyards in production – more than at any other time over the previous millennium. The website of the English wine producers suggests that at present extent of vineyards in Britain probably surpasses that of the Medieval Warm Period between circa 900 AD to 1300 AD.
https://www.reading.ac.uk/news-and-events/releases/PR717721.aspx
Bonus:
Regional climate impacts of a possible future grand solar minimum
Any reduction in global mean near-surface temperature due to a future decline in solar activity is likely to be a small fraction of projected anthropogenic warming. However, variability in ultraviolet solar irradiance is linked to modulation of the Arctic and North Atlantic Oscillations, suggesting the potential for larger regional surface climate effects. Here, we explore possible impacts through two experiments designed to bracket uncertainty in ultraviolet irradiance in a scenario in which future solar activity decreases to Maunder Minimum-like conditions by 2050. Both experiments show regional structure in the wintertime response, resembling the North Atlantic Oscillation, with enhanced relative cooling over northern Eurasia and the eastern United States. For a high-end decline in solar ultraviolet irradiance, the impact on winter northern European surface temperatures over the late twenty-first century could be a significant fraction of the difference in climate change between plausible AR5 scenarios of greenhouse gas concentrations.
https://www.nature.com/articles/ncomms8535
Global Signatures and Dynamical Origins of the Little Ice Age and Medieval Climate Anomaly
Abstract
Global temperatures are known to have varied over the past 1500 years, but the spatial patterns have remained poorly defined. We used a global climate proxy network to reconstruct surface temperature patterns over this interval. The Medieval period is found to display warmth that matches or exceeds that of the past decade in some regions, but which falls well below recent levels globally. This period is marked by a tendency for La Niña–like conditions in the tropical Pacific. The coldest temperatures of the Little Ice Age are observed over the interval 1400 to 1700 C.E., with greatest cooling over the extratropical Northern Hemisphere continents. The patterns of temperature change imply dynamical responses of climate to natural radiative forcing changes involving El Niño and the North Atlantic Oscillation–Arctic Oscillation.
While England had 42 vineyards at the time of the Domesday Book, as is well known, there are now over 300 commercial English vineyards today. So the climate today in England is much more conducive to wine-making than during the Roman occupation of England.
www.english-wine.com/vineyards.html
By 1977, there were 124 reasonable-sized vineyards in production – more than at any other time over the previous millennium. The website of the English wine producers suggests that at present extent of vineyards in Britain probably surpasses that of the Medieval Warm Period between circa 900 AD to 1300 AD.
Det er blitt nesten 900 vingårder i England og Wales. Salget gikk opp 69 prosent fra 2019 til 2021.
https://www.nrk.no/urix/klimaendringer-gir-britisk-vinsuksess-1.16048956?fbclid=IwAR3PK0cE1qjSvwkCvGC-ssYzxNH5oTxEU7UhFqbWQZ9wnCRVX7FIN5wQLw8
www.realclimate.org/index.php/archives/2006/07/medieval-warmth-and-english-wine/
www.newscientist.com/article/dn11644-climate-myths-it-was-warmer-during-the-medieval-period-with-vineyards-in-england.html# dot.VRfu7OE0_b4
www.newscientist.com/data/images/ns/cms/dn11648/dn11648-2_726.jpg
www.eh-resources.org/climate1.html

Sea ice can't be in decline until it has completely disappeared?
You're just like the people saying the coronavirus can't kill Alaskans because it hasn't killed many yet.
Klimafornekterne har produsert hundrevis av artikler om forskningsskip som sitter fast i is
og følger opp med å kirsebærplukke bilder fra NASA som viser at isen i
arktis har vokst. De har heller ingen problemer med å hente sine klimaløgner selv fra alt-right white supremacy-rasist koko-høyre blogger som breitbart. (Hvorfor går de ikke videre til den NASA-siden som har
bevisene for AGW?)
Mengden sjøis er en nedadgående trend. Den er ikke borte. Dette betyr at den fremdeles er der og kan fange skip. Til den faktisk blir borte. Er det vanskelig å forstå? Har du 20 krabbeteiner i sjøen og reduserer antallet til 10, slutter du ikke å fange krabber. Du fanger bare færre.
INGENTING av dette motbeviser global oppvarming. Det nevnte skipet måtte avbryte på grunn av mye is i bevegelse, et resultat av global oppvarming "Climate-related changes in Arctic sea ice not only reduce its extent and thickness but also increase its mobility meaning that ice conditions are likely to become more variable and severe conditions such as these will occur more often."
Antarctic Ship Rescue: 5 Lessons From the Trapped-Vessel Drama
Kevin Trenberth, senior scientist at the National Center for Atmospheric Research, added by email that "any comments about overall ice shrinking or increasing are absurd in this situation.
"In the Antarctic, the ice is not limited by land and it is well established that winds blow the ice around. Winds from the south, especially off the continent, carry ice away from the continent and create more ice behind, filling in any gaps."

As Arctic sea ice breaks up, it’s starting to move southward faster, creating new and unexpected hazards. More icebergs calving off Greenland add to the threat.
First ship crosses Arctic in winter without an icebreaker as global warming causes ice sheets to melt
http://www.independent.co.uk/environment/arctic-sea-route-first-ship-no-icebreaker-winter-icebergs-ice-shelf-teekay-russia-a8208596.html
Shipping first as commercial tanker crosses Arctic sea route in winter:
he Multidisciplinary drifting Observatory for the Study of Arctic Climate (MOSAiC), is on a yearlong expedition to study Arctic ice in the central region of the Arctic. Recently, the German research icebreaker Polarstern, the MOSAIC expedition ship, sailed from the northern part of the Fram Strait to the North Pole by following a route along the northern border of Greenland, which in the past was packed with thick, multi-year sea ice, and was virtually impassible throughout the year. But this year offered smooth sailing for the icebreaker all the way to the North Pole, demonstrating the profound loss of multi-year sea ice in Arctic, and suggesting ice-free Arctic summers by 2035 is not a theoretical scenario but rather an unavoidable fact
________________________________________________________________________
So I did a debunking of it:
Dr David Viner at CRU, England, never said that "Snowfalls are now just a thing of the past.". That was the headline the newspaper choose for their article, making it more sensational but losing the plot.
Dr Viner was also quoted as saying: "We're really going to get caught out. Snow will probably cause chaos in 20 years time."
The headline in this case is not what the story itself said, as Dr Viner made clear. The story was about the frequency of snowfalls, and how "snow is starting to disappear from our lives", which it stated clearly.
So a headline saying that "snowfalls are now just a thing of the past" is not a scientific prediction or statement. It is a newspaper headline, and should be treated as an invitation to read the entire story, which in this case clearly pointed out that snowfalls are becoming less frequent in Britain.
"A more accurate headline would be something like: "Snowfalls are becoming less frequent in our little corner of the world but that doesn't necessarily mean that snow will disappear from our lives completely and forever." Unfortunately, any sub-editor who would suggest such a tediously long headline is unlikely to last very long."
https://www.independent.co.uk/news/science/steve-connor-dont-believe-the-hype-over-climate-headlines-2180195.html
https://www.independent.co.uk/news/science/steve-connor-dont-believe-the-hype-over-climate-headlines-2180195.html
Sigbjørn Eskeland
Dr David Viner ved CRU, England, sa aldri at "snøen vil forsvinne".
Det var overskriften avisen valgte på intervjuet , noe som gjorde saken mer oppsiktsvekkende, men som mistet poenget.
Dr Viner sa i tillegg
-Vi kommer virkelig til å bli tatt på sengen. Snø vil sannsynligvis forårsake kaos om 20 år!
Historien handlet om hyppigheten av snøfall, og hvordan "snøen begynner å forsvinne fra livene våre", som den tydelig sa.
Så en overskrift som sier at "snøfall er nå bare en ting fra fortiden" er ikke en vitenskapelig spådom eller uttalelse.
Det er en avisoverskrift, og bør behandles som en invitasjon til å lese hele historien, som i dette tilfellet tydelig påpekte at snøfall blir mindre hyppige i Storbritannia.
Anyway. Climate science dont make predictions based on a newspaper interview with one (1) scientist. Its the combined knowledge from thousands of scientists world wide. Look for the predictions in the peer reviewed science and the peer reviewed reports.
Like this one out from the USA in the autumn of 2017 which was peer reviewed by the National Academy of Sciences, the worlds most respected scientific academy, founded by Abraham Lincoln and with 200 Nobel Prize winners as members.
https://science2017.globalchange.gov/
For regions that are less than 1000m above sea level and that currently experience winter temperatures just below freezing, he found that the chance of an extreme snowfall event will drop by an average of just 8%. But the total amount of snow that falls in these areas each winter may drop by as much as 65%, on average.
http://www.bbc.com/earth/story/20160127-will-snow-become-a-thing-of-the-past-as-the-climate-warms
Dr David Viner ved CRU, England, sa aldri at "Britiske barn vil ikke lenger vite hva snø er." Det var overskriften avisen valgte for artikkelen, noe som gjorde den mer sensasjonell (clickbait) , men som dessverre gjorde at den mistet tråden.
Dr Viner sa og: "We're really going to get caught out. Snow will probably cause chaos in 20 years time."
Overskriften i dette tilfellet reflekterer altså ikke hva intervjuet handlet om , som Dr. Viner gjorde klart. Historien handlet om hyppigheten av snøfall, og hvordan "snø begynner å forsvinne fra livene våre".
En overskrift som sier at "snøfall er nå bare en ting fra fortiden" er ikke en vitenskapelig projeksjon . Det er en avisoverskrift, og bør behandles som en invitasjon til å lese hele historien, som i dette tilfellet tydelig påpekte at snøfall blir mindre hyppig i Storbritannia.
"A more accurate headline would be something like: "Snowfalls are becoming less frequent in our little corner of the world but that doesn't necessarily mean that snow will disappear from our lives completely and forever." Unfortunately, any sub-editor who would suggest such a tediously long headline is unlikely to last very long."
Uansett. Klimavitenskapen er aldri basert på et avisintervju med en (1) forsker. Men den kombinerte kunnskapen fra tusenvis av forskere over hele verden. Se etter vitenskapen i fagfellevurderte vitenskap og fagfellevurderte rapporter. Ikke i aviser.
Uansett. Klimavitenskapen er aldri basert på et avisintervju med en (1) forsker. Men den kombinerte kunnskapen fra tusenvis av forskere over hele verden. Se etter vitenskapen i fagfellevurderte vitenskap og fagfellevurderte rapporter. Ikke i aviser.
Ingen kommentarer:
Legg inn en kommentar